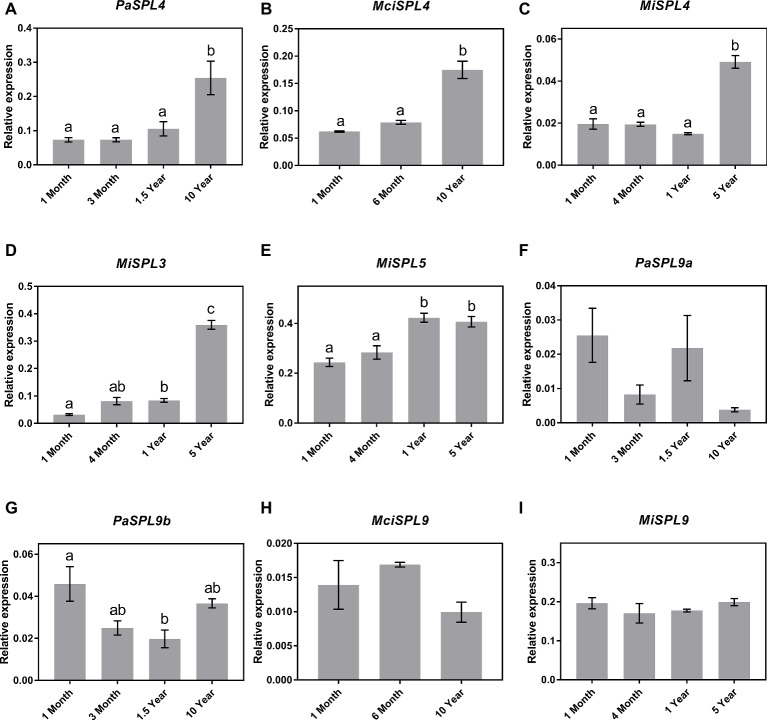
Figure 3.
Expression of miR156 putative target genes at various stages of the avocado, mango, and macadamia life cycle. Relative abundance was quantified by qRT-PCR in leaves of miR156-targeted (A) PaSPL4, (B) MciSPL4, (C) MiSPL4, (D) MiSPL3, (E) MiSPL5, (F) PaSPL9a, (G) PaSPL9b, (H) MciSPL9, and (I) MiSPL9. Error bars represent standard error of the mean (n = 3 biological pools of 6–15 plants), and significant differences calculated by one-way ANOVA are shown by different letters (p < 0.05).

