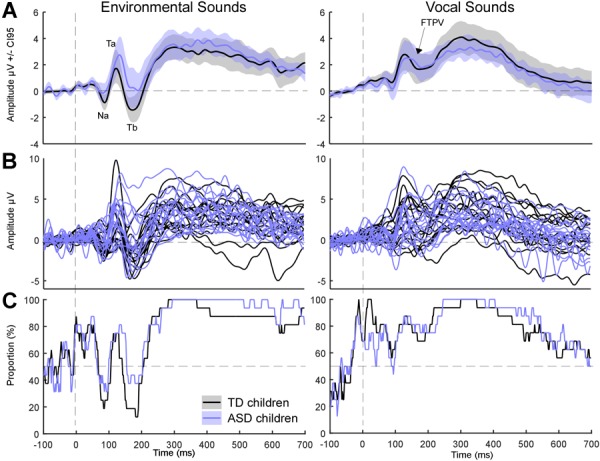
FIGURE 1.

Event-related potentials for environmental and vocal sounds (on T8). Colored lines illustrate ERPs for ASD children. Black lines are for TD children. (A) Grand average ERPs. Shaded areas represent the 95% confidence interval built using bootstrap (n = 1000) with replacement of the data under H1. Note that Tb was more negative in TD children than in ASD children. (B) Individual ERPs. (C) Percentage of subjects showing a positive activity at each time point.
