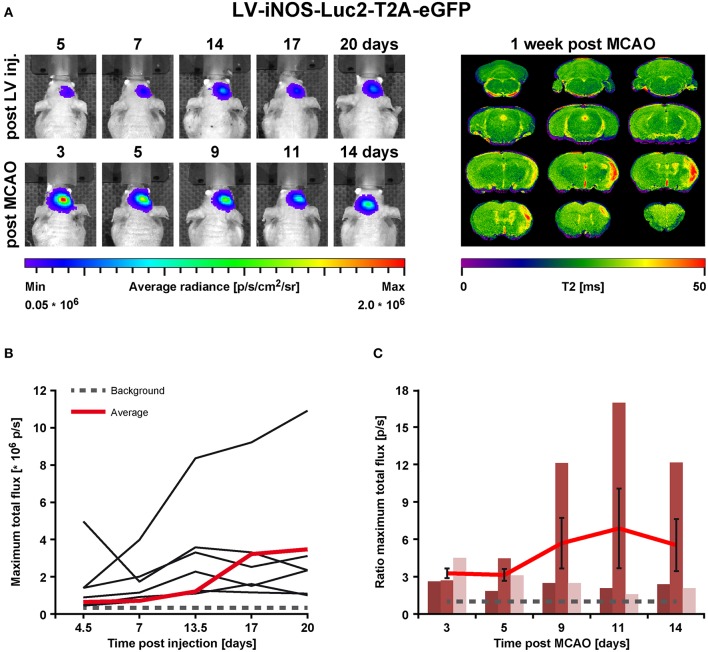
Figure 3.
BLI in vivo analysis of iNOS activity in LV-iNOS-IR injected brains before and after MCAO. (A) BLI signal distribution over time in one representative animal before (upper row) and after MCAO (bottom row) with the corresponding MRI T2 map (right). (B) BLI signals, indicated as maximum total flux in p/s, increased during the first 2 weeks after LV injections and, except for one outlier, reached steady state thereafter. The gray dotted line indicates the background threshold. (C) After MCAO, BLI signals strongly increased in animals with cortico-striatal lesions with inter-individual variability. For each individual animal, the pre-stroke values at the last 3 days before stroke induction (i.e., at days 14, 17, and 20 post virus injection) were averaged. This average values was used to normalize the post-stroke signal intensities to. For better visualization, the dotted line indicates a ratio of 1. Error bars represent + SEM (n = 6 before MCAO) or ± SEM (n = 3 after MCAO). IR, imaging reporter (Luc2-T2A-eGFP); p/s, photons per second.

