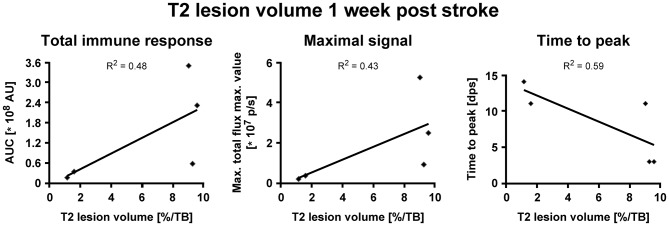
Figure 5.
Correlation of iNOS-dependent BL signal intensities and T2 lesion volumes after stroke. T2 lesion volumes were calculated at 1 week post stroke. (A) BLI signal integration over time, designated as area under curve (AUC), and (B) the maximum values of emitted photons moderately positively correlated with T2 lesion volumes. (C) The time to peak negatively correlated with T2 lesion volumes. AU, arbitrary units; dps, days post stroke.

