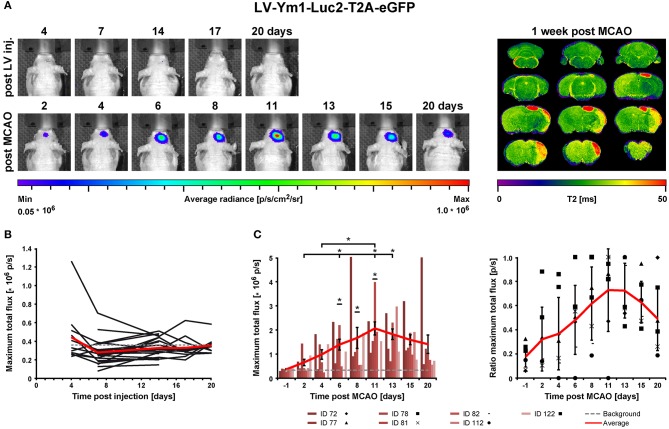
Figure 6.
BLI in vivo analysis of Ym1 activity before and after stroke induction. (A) Longitudinal BLI signal development in one representative mouse before (upper row) and after MCAO (bottom row) with the corresponding MRI T2 map on the right. After stroke, signals increased strongly in animals with cortico-striatal lesions. (B) Before MCAO, BLI signal intensities, except for one animal, were below or close to the background threshold (gray dotted line). (C) After MCAO, BLI signal continuously increased in animals with cortico-striatal lesions until day 11, which was significantly different between 6 and 11 dps compared to all time points before stroke induction. BL signals on (6, 11, and 13) dps were significantly increased compared to 2 dps, and BLI signals on 11 dps were significantly increased compared to 4 dps. Raw data of maximum BLI signals are presented as total flux in the left diagram. Error bars represent ± SEM (left). In the right diagram, the values of the raw data were normalized to the maximal BLI signal of each individual, identified in the left diagram. Error bars represent ± STD (right). The red lines indicate average signals of each time point and the gray dotted line the background threshold. Wilcoxon Signed-Rank test was performed, *p ≤ 0.05. IR, imaging reporter (Luc2-T2A-eGFP); p/s, photons per second.

