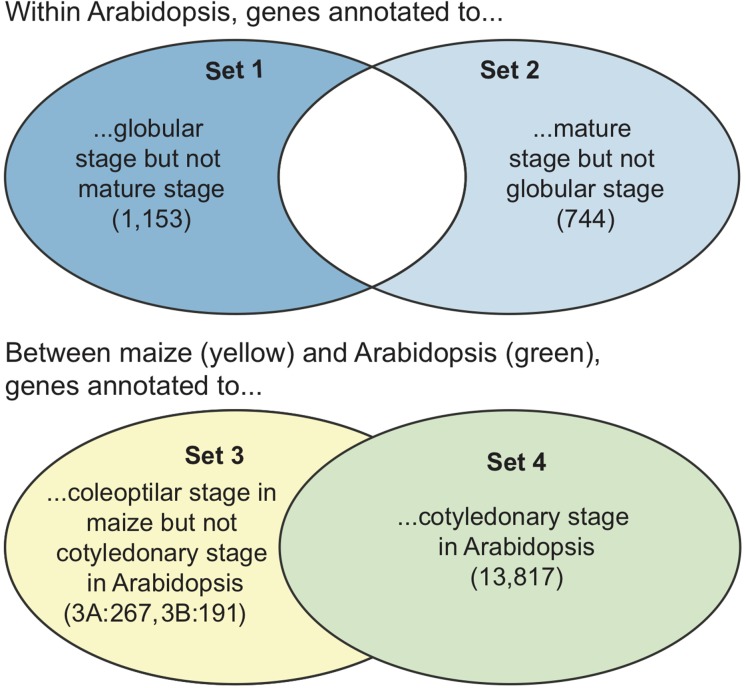
FIGURE 5.
A graphical view of the sets of genes used in the GO term enrichment comparisons. Note that the final sets of genes only include those that are in the GO database, so the sets are slightly smaller than the input lists (see Supplementary Table S6). (Top) The sets of genes compared within Arabidopsis. Only non-overlapping sets were compared. (Bottom) The sets of genes (as maize gene IDs or Arabidopsis gene IDs converted from orthoIDs) compared between Arabidopsis and maize. The full set of Arabidopsis genes was compared to the non-overlapping genes from maize. Numbers in parentheses are the numbers of genes in each set. Set 3 was analyzed two ways, with maize gene IDs (set 3A) and with Arabidopsis gene IDs (set 3B).

