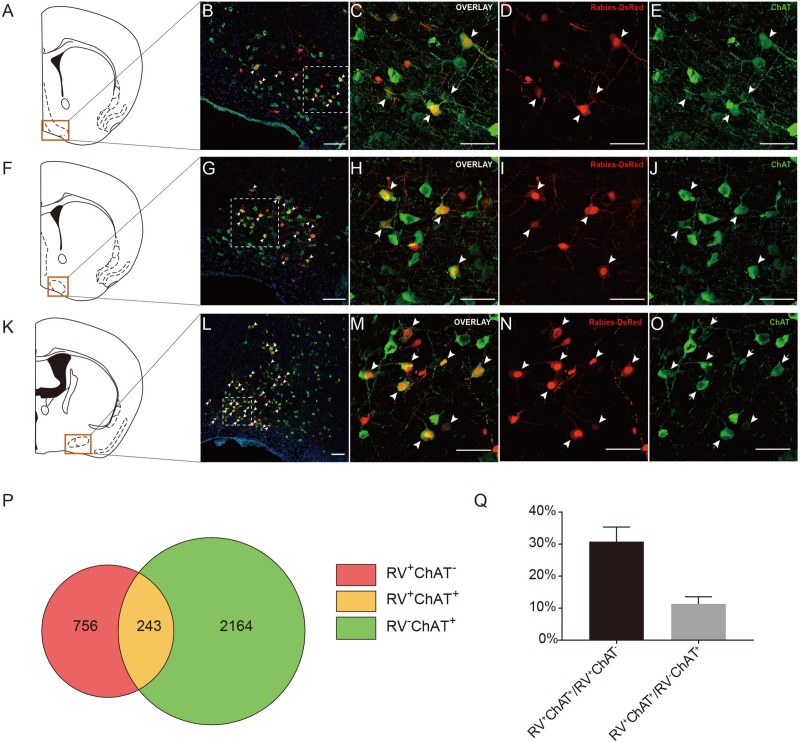
FIGURE 4.
Immunochemical characterization and quantification of rabies-labeled neurons in NDB presynaptic to the ACC CRH neurons. (A–O) Immunostaining of choline acetyltransferase (ChAT) in brain slices with rabies-labeled diagonal band nucleus (NDB) neurons. Panels (A,F,K) show three diagrams of anterior-posterior NDB sections. Red boxes indicate the regions shown in (B,G,L). Panels (C–E) show enlarged views of the white-boxed regions in (B). Panels (H–J) show enlarged views of the white-boxed regions in (G). Panels (M–O) show enlarged views of the white-boxed regions in (L). The rabies-labeled cells and ChAT+ cells are shown in red and green, respectively. Scale bars: 100 μm in (B,G,L) and 50 μm in (C,D,E,H,I,J,M–O). (P,Q) Pie chart (P) and bar chart (Q) analyses illustrating the proportions of RV+ChAT+ neurons in RV+ neurons or ChAT+ neurons. Mean ± SEM (n = 5 CRH-ires-Cre mice).

