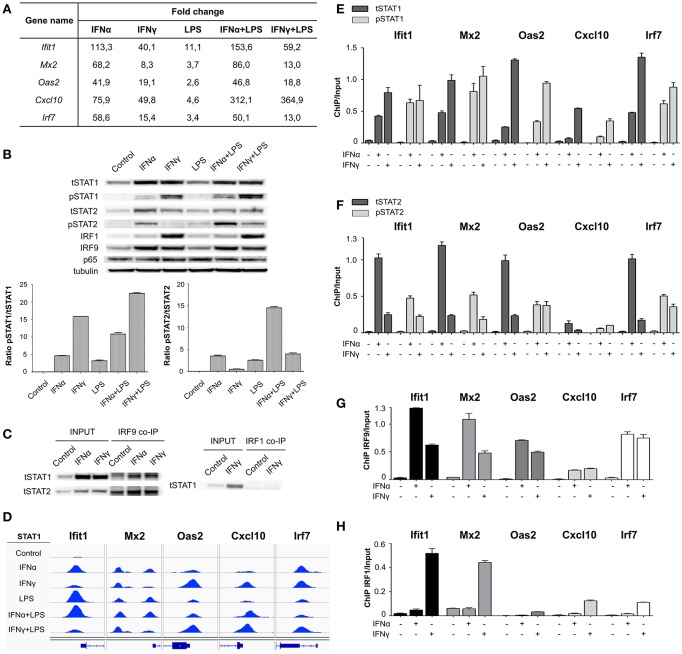
Figure 3.
STAT1, STAT2, IRF9, and IRF1 in transcriptional regulation of ISRE-containing genes under stimulation with IFN-I and IFN-II. (A) Gene expression values (FC in comparison to control) for Ifit1, Mx2, Oas2, Cxcl10, and Irf7 genes, resulting from RNA-seq: VSMC untreated or treated with IFNα (8 h), IFNγ (8 h), LPS (4 h), IFNα (8 h) + LPS (4 h), IFNγ (8 h) + LPS (4 h). (B) Western blot. Protein extracts were isolated from VSMC untreated or treated with IFNα (8 h), IFNγ (8 h), LPS (4 h), IFNα (8 h) + LPS (4 h), IFNγ (8 h) + LPS (4 h). Levels of tSTAT1, pSTAT1, tSTAT2, pSTAT2, IRF1, IRF9, p65, and tubulin were assessed by Western blot. n = 3, one representative blot is presented; Western blot quantification. Bars represent mean quantification of pSTAT1/tSTAT1 and pSTAT2/tSTAT2 ratio (normalized to tubulin). Mean ± s.e.m., n = 3; (C) Co-IP. Protein extracts were isolated from VSMC untreated or treated with IFNα (8 h) and IFNγ (8 h), immunoprecipitated with IRF9 or IRF1 antibodies and analyzed by tSTAT1 and/or tSTAT2 Western blot. n = 3, one representative blot is presented. (D) Representative views of STAT1 ChIP-seq peaks detected in the ISRE-containing promoters of Ifit1, Mx2, Oas2, Cxcl10, and Irf7 genes, in untreated or IFNα (8 h), IFNγ (8 h), LPS (4 h), IFNα (8 h) + LPS (4 h), IFNγ (8 h) + LPS (4 h)-stimulated VSMC. STAT1 peaks were mapped onto the mouse reference genome mm10 and visualized using the IGV genome browser. (E) VSMC were untreated or treated with IFNα (8 h) and IFNγ (8 h) and ChIP-PCR validation of tSTAT1 and pSTAT1 binding to ISRE motif present in the promoters at Ifit1, Mx2, Oas2, Cxcl10, and Irf7 genes was performed. Mean ± s.e.m., n = 2. Primers are listed in Table S2. ChIP-PCR. VSMC were untreated or treated with IFNα (8 h) and IFNγ (8 h), chromatin was isolated and immunoprecipitated with (F) tSTAT2, pSTAT2, (G) IRF9 and (H) IRF1 antibodies, followed by ChIP-PCR analysis. Mean ± s.e.m., n = 2. Primers are listed in Table S2.

