Figure 4.
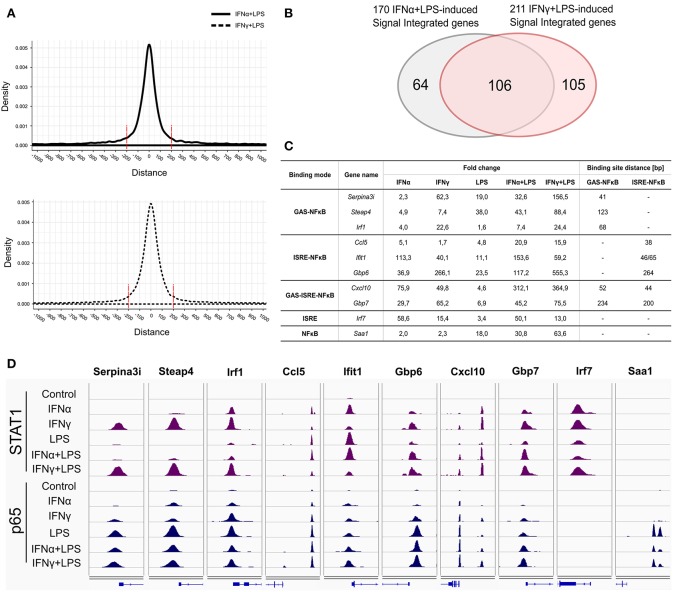
Representatives of STAT1 and p65 “single” and “co-binding” modes. (A) Peak distribution plots showing distances between summits of STAT1 and the closest p65 peak summits resulted from ChIP-seq in VSMC under IFNα (8 h) + LPS (4 h) and IFNγ (8 h) + LPS (4 h) treatment conditions. (B) Venn diagram showing the intersection of 170 IFNα (8 h) + LPS (4 h)- and 211 IFNγ (8 h) + LPS (4 h)-activated SI genes resulting from RNA-seq. (C) Table presents gene expression values (FC in comparison to control), resulting from RNA-seq experiment: VSMC treated with IFNα (8 h), IFNγ (8 h), LPS (4 h), IFNα (8 h) + LPS (4 h), IFNγ (8 h) + LPS (4 h) and GAS-NFκB and ISRE-NFκB binding sites distance (bp) for selected genes representing identified STAT1 and p65 ‘co-binding’ modes: GAS-NFκB: Serpina3i, Steap4, Irf1; ISRE-NFκB: Ccl5, Ifit1, Gbp6; GAS-ISRE-NFκB: Cxcl10 and Gbp7; ISRE: Irf7; NFκB: Saa1. (D) Representative views of STAT1 and p65 ChIP-seq peaks (STAT1: violet peaks, p65: dark blue peaks) identified in the regulatory regions of Serpina3i, Steap4, Irf1, Ccl5, Ifit1, Gbp6, Cxcl10, Gbp7, Irf7, and Saa1 genes, in untreated or IFNα (8 h), IFNγ (8 h), LPS (4 h), IFNα (8 h) + LPS (4 h), IFNγ (8 h) + LPS (4 h)-stimulated VSMC. STAT1- and p65-binding peaks were mapped onto the mouse reference genome mm10 and visualized using the IGV genome browser.

