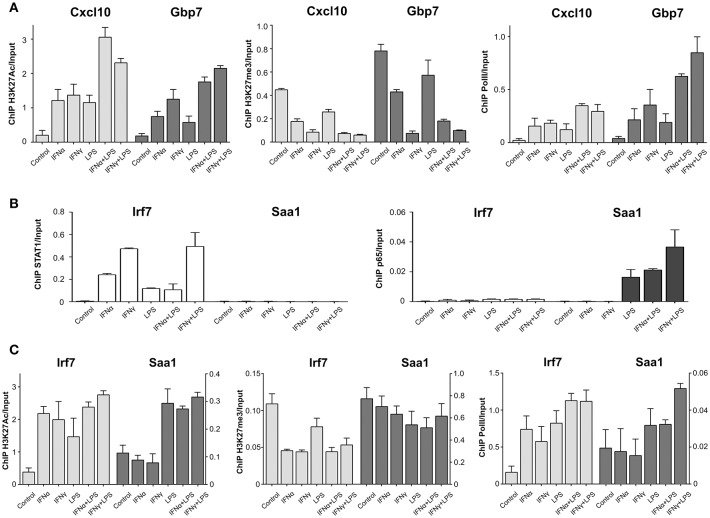
Figure 6.
PolII and histone modification changes upon stimulation with IFNs and LPS at promoters of STAT1 and p65 “co-binding” and “single” modes representatives. (A) ChIP-PCR of H3K27Ac, H3K27me3, and PolII at Cxcl10 and Gbp7 gene promoters (primers are listed in Table S2) in VSMC treated with IFNα (8 h), IFNγ (8 h), LPS (4 h), IFNα (8 h) + LPS (4 h), IFNγ (8 h) + LPS (4 h). Mean ± s.e.m., n = 2. (B) ChIP-PCR of STAT1 and p65 at Irf7 and Saa1 gene promoters (primers are listed in Table S2) in VSMC treated with IFNα (8 h), IFNγ (8 h), LPS (4 h), IFNα (8 h) + LPS (4 h), IFNγ (8 h) + LPS (4 h). Mean ± s.e.m., n = 2. (C) ChIP-PCR of H3K27Ac, H3K27me3 and PolII at Irf7 and Saa1 gene promoters (primers are listed in Table S2) in VSMC treated with IFNα (8 h), IFNγ (8 h), LPS (4 h), IFNα (8 h) + LPS (4 h), IFNγ (8 h) + LPS (4 h). Mean ± s.e.m., n = 2.

