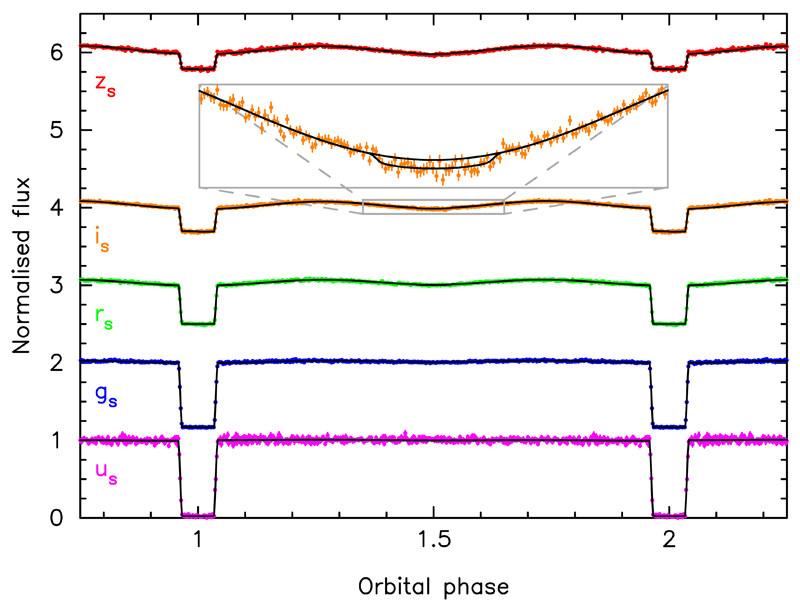
Figure 3.
Phase-folded HiPERCAM light curves of SDSS J2355+0448 with model fits over-plotted (black lines). The gs, rs, is and zs band data have been binned by a factor of three and offset vertically for clarity. We show a zoom-in to the is band light-curve, which displays the secondary eclipse (i.e. the transit of the white dwarf in front of the cool subdwarf). Over-plotted is our best fit model with the secondary eclipse turned on and off to demonstrate its depth. The error bars represent ±1σ uncertainties.

