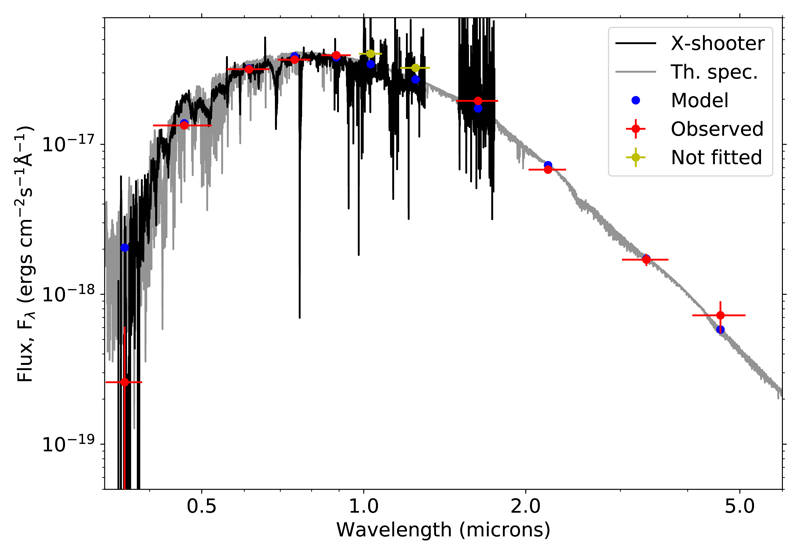
Figure 4.
The observational SED of the cool subdwarf in SDSS J2355+0448 (black line, note the white dwarf contribution has been subtracted) and its best-fit model performed by VOSA (gray line). The observational photometric points are shown in red (optical points are obtained by us directly from the light curve during white dwarf eclipse) and the blue dots are the synthetic photometry. The yellow dots are UKIDSS y j photometry that have not been used in the fit due to white dwarf flux contamination. The error bars represent ±1σ uncertainties.

