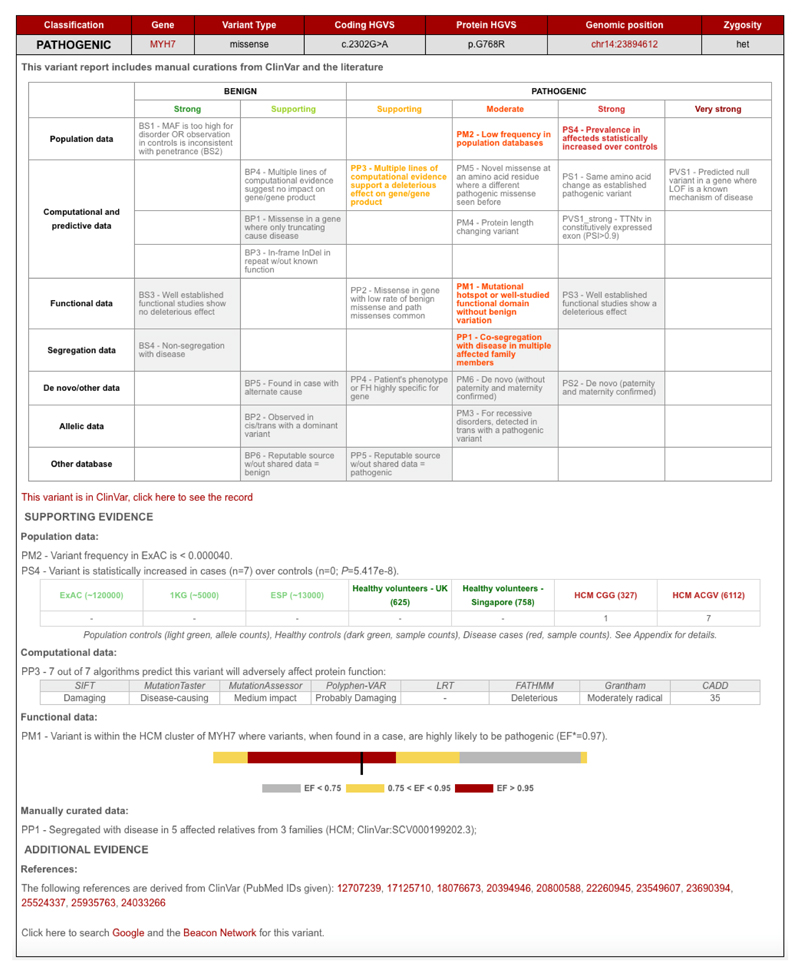
Figure 1. Example variant report output by CardioClassifier.
A grid is output for each individual variant. Rules highlighted in colour are activated for the variant and rules in grey on a white background are assessed but not activated. A user can click on a rule to manually add or remove a piece of evidence. All evidence used to assess the variant is displayed under the grid along with links out to external resources. An overall classification for the variant using the ACMG/AMP logic is displayed in the top left corner. *EF - etiological fraction; the prior probability that a variant, identified in a case, is Pathogenic9.

