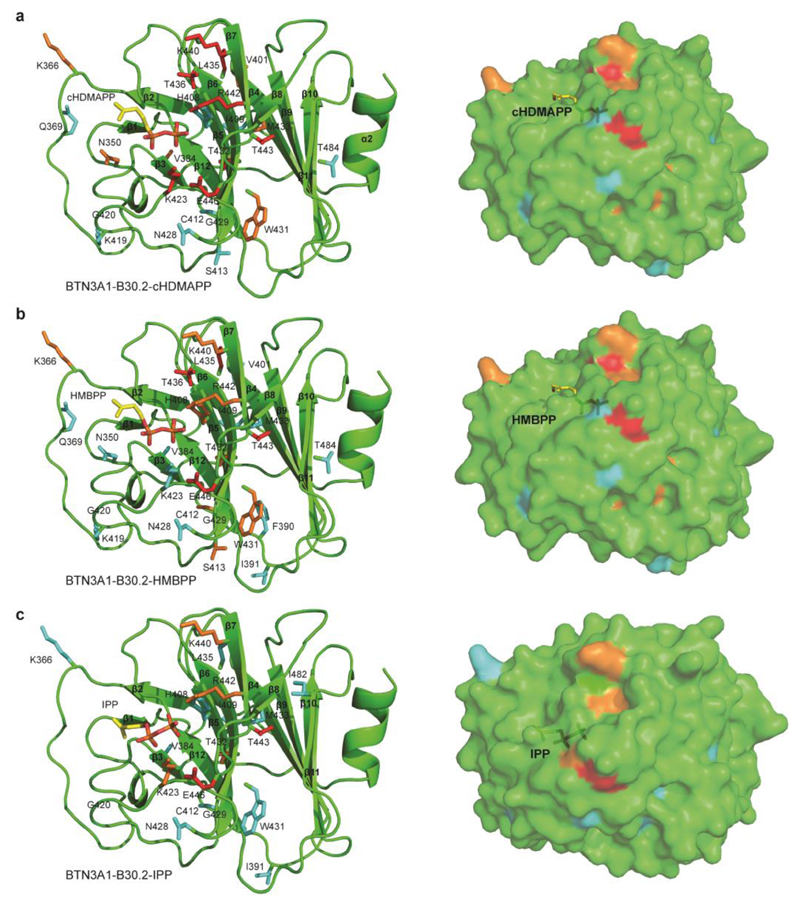
Figure 4. Chemical shift perturbation mapping of the cHDMAPP, HMBPP and IPP binding sites on BTN3A1-B30.2 domain.
a) Surface mapping of perturbed residues of BTN3A1-B30.2 (shown as stick format) upon cHDMAPP binding. Residues are coloured based on small (cyan), medium (orange) and large (red) chemical shift perturbations. cHDMAPP is shown as stick format. b) Surface mapping of perturbed residues of BTN3A1-B30.2 (shown as stick format) upon HMBPP binding. Residues are coloured based on small (cyan), medium (orange) and large (red) chemical shift perturbations. HMBPP is shown as stick format. c) Surface mapping of perturbed residues of BTN3A1-B30.2 (shown as stick format) upon IPP binding. Residues are coloured based on small (cyan), medium (orange) and large (red) chemical shift perturbations. IPP is shown as stick format.

