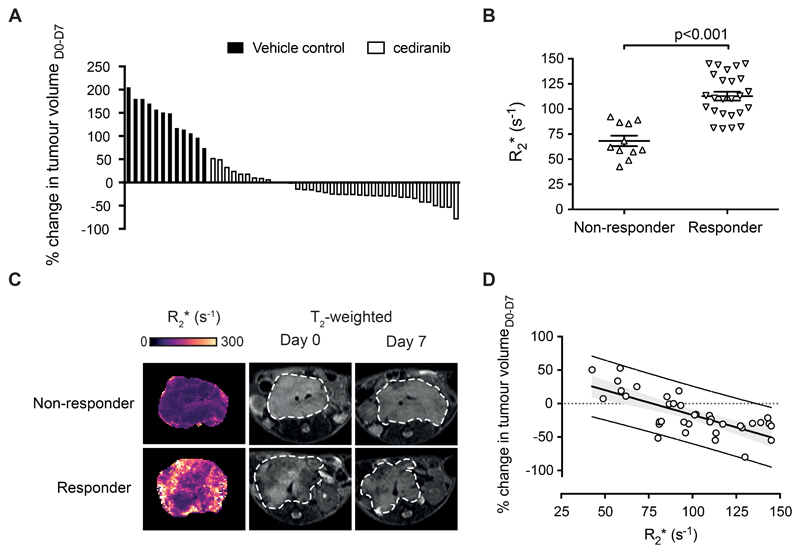
Fig. 2.
Intrinsic susceptibility MRI-derived transverse relaxation rate R2* predicts response to vascular endothelial growth factor receptor (panVEGFR) inhibitor cediranib in the Th-MYCN model of neuroblastoma. (A) Waterfall plot documenting relative changes in tumor volume in the Th-MYCN mouse model of neuroblastoma following seven-day treatment with daily dose of 6mg/kg cediranib or vehicle (ΔVolumecediranib_D0-D7= -16±5% vs ΔVolumevehicle_D0-D7= 142±11%, p<0.0001, two-tailed unpaired Student’s t-test with a 5% level of significance). (B) Baseline R2* value (Day 0) of responsive and non-responsive tumors (Data are the individual median value for each tumor and the cohort mean ± 1 s.e.m., p<0.0001, two-tailed unpaired Student’s t-test with a 5% level of significance). (C) Representative baseline native R2* maps for responsive and progressive tumors in Th-MYCN transgenic mice (assessed by anatomical MRI) following daily treatment with 6mg/kg cediranib for 7 days. (D) Native tumor median R2* (Day 0) correlated with relative change in tumor volume following daily treatment with 6mg/kg cediranib for 7 days (r= -0.72, p<0.001).

