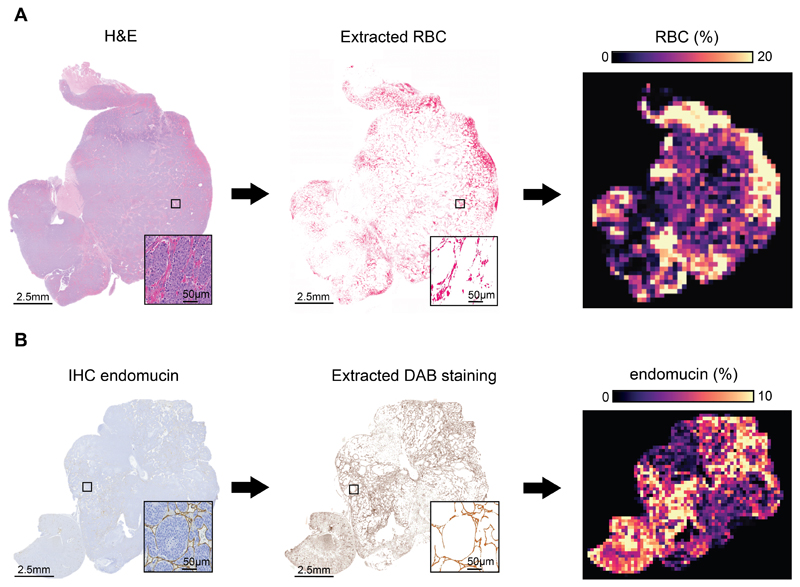
Fig. 3.
Pipeline for the generation of computed maps of red blood cells (RBC) and endomucin staining from histopathological images in Th-MYCN tumors. (A) RBC were automatically extracted from hematoxylin and eosin (H&E)-stained whole section slides with an accuracy of 99.74%. (B) Endomucin staining was extracted from chromogenic immunohistochemistry whole section slides with an accuracy of 97%. Note that the contrast of the whole slide extracted endomucin was enhanced, solely for printing visibility. Whole-section images were subsequently processed to match the MRI resolution, with the fraction of pixels occupied by red blood cells (A) and endomucin (B) within 518x518 pixels of the original images, representing a single pixel in the final maps.

