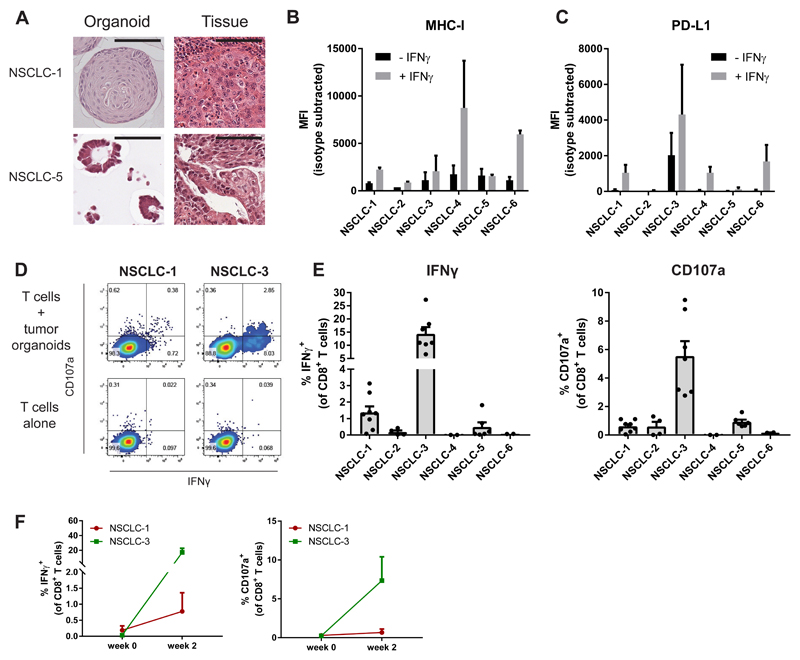
Figure 3. Induction of tumor reactivity in circulating T cells from patients with NSCLC.
(A) Haematoxylin and eosin staining of tumor organoids and original tumor tissue. Organoids show morphology similar to the architecture of the original tumor. NSCLC-1 organoids consists of large cells forming a solid mass, similar to the primary tumor. NSCLC-5 organoids are composed of tubular glands similar to the original tumor. Scale bar = 100 μm.
(B-C) Cell surface MHC-I (B) and PD-L1 (C) expression as determined by flow cytometry. Organoids were stimulated with 200 ng/mL IFNγ for 24 hours or left unstimulated. Bar graphs indicate median fluorescence intensity (MFI) of anti-HLA-A,B,C-PE or anti-PD-L1-APC minus MFI of isotype control. Error bars indicate s.e.m. of two independent experiments.
(D) Representative flow cytometry plots gated on CD8+ T cells tested for reactivity against autologous organoids after two weeks of co-culture with autologous tumor organoids.
(E) Quantification of organoid-induced IFNγ production and CD107a cell surface expression of CD8+ T cells obtained by two week co-culture with autologous tumor organoids. Background (spontaneous IFNγ production or CD107a expression) is subtracted from signal. Error bars indicate s.e.m. of at least 2 biological replicates. Dots indicate biological replicates.
(F) Quantification of organoid-induced IFNγ production and CD107a cell surface expression of CD8+ T cells directly after PBL isolation, or obtained by two week co-culture with autologous tumor organoids. Background (spontaneous IFNγ production or CD107a expression) is subtracted from signal. Error bars indicate s.e.m of n = 2 biological replicates.
See also Figure S3.

