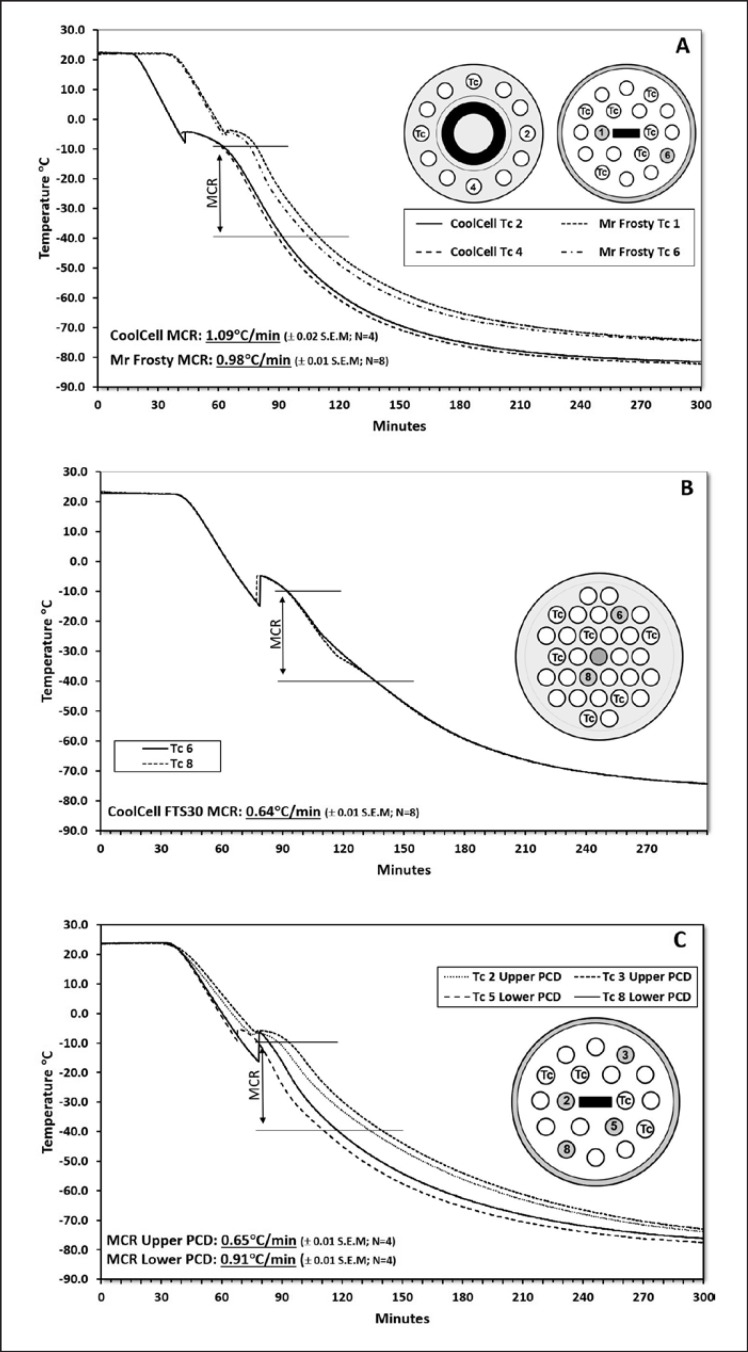
Fig. 1.
Typical cooling curves for PCDs. PCDs were operated according to the manufacturer's instructions. Thin wire thermocouples (TWTc) were inserted through adapted PCD lids into the centre of specially adapted cryovials containing 1 mL of CPA (10% DMSO in FBS). These were then placed in the PCD. The remaining spaces were filled with cryovials containing 1 mL of CPA. All cryovials were equilibrated at 20°C for between 20 and 30 min before transfer of the PCD to a monitored, controlled-access −80°C freezer. The temperature was recorded every 6 s for 5 h using a multi-channel datalogger. The illustrations show position of the TWTc. Mean cooling rate (MCR) between −10 and −40°C was based on the number of technical replicates per experiment shown on the graph. A minimum of 3 experiments were performed in each group. A PCDs Mr Frosty and CoolCell 12. B CoolCell FTS30 (note reduced cooling rate compared to the CoolCell 12). C Stacked PCDs. Two Mr Frostys were treated as above but stacked on top of each other and placed within the same compartment of the −80°C freezer. Of the 4 TWTc shown, two were housed in the upper and two in the lower PCD. Note the significantly reduced cooling rate for cryovials in the upper PCD.

