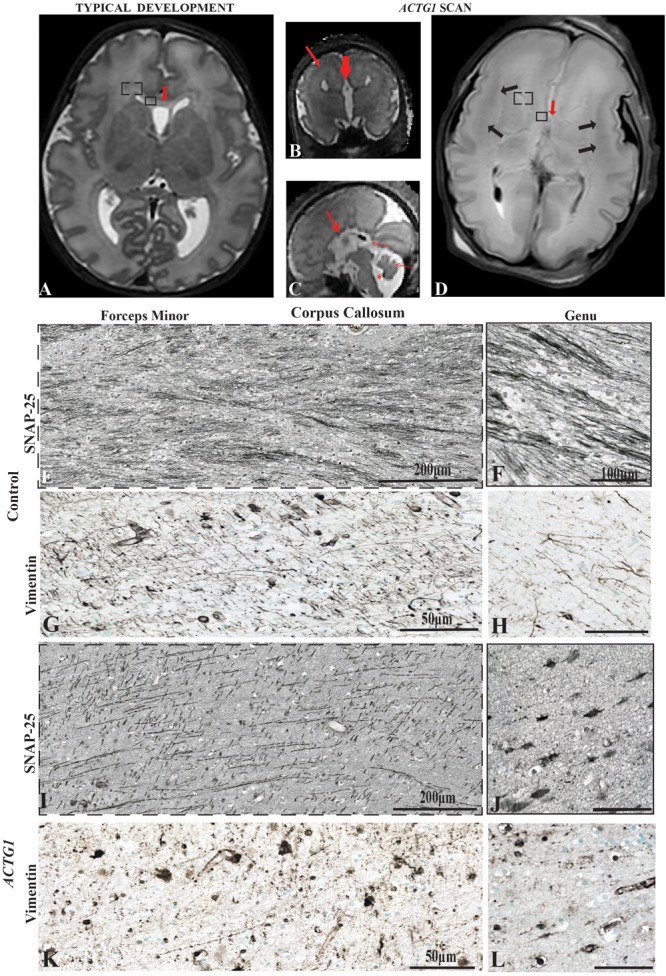
FIGURE 1.

Magnetic Resonance Imaging axial plane using T2 weighted images. In the transverse orientation, the scans show normal anatomical characteristics of a fetal brain at 35 GA wks (A). Coronal T2 weighted image of the case with a variant in the ACTG1 gene and agenesis of the corpus callosum with neuronal heterotopia (ACC-H) at 35.30 weeks showing the absence of the corpus callosum (thick red arrow) and prominent low signal intensity band in the subcortical white matter (thin red arrow; B). The sagittal T2 weighted image of the ACTG1 variant, shows the absence of the corpus callosum (thick red arrow) and shortened cerebellar vermis, rotated away from the brainstem (thin red arrow) giving an enlarged fourth ventricle (asterisk; C). The genu of the corpus callosum is seen in panel (A; red arrow) but is absent in the case with agenesis of the corpus callosum (ACTG1 variant, D, red arrow). On post-mortem imaging, the brain in the fetal case with ACTG1 variant (D) showed an absence of the corpus callosum and decreased cortical folding frontally. There is extensive bilateral abnormal low signal intensity within the subcortical white matter (black arrows) on the T2 weighted MRI. Immunostaining of SNAP-25 (E,F,I,J) and vimentin (G,H,K,L) from the forceps minor (E,G,I,K) and the genu (F,H,J,L) of the corpus callosum of the frontal lobe (represented as a box-in region in images A,D). Image E shows normal axonal fibers in the control, whereas, in the photomicrograph I the axons are not as numerous and have unusual tangential fibers seen in ACTG1 variant. Images (F,J), show SNAP-25 positive fibers in the genu of the corpus callosum from the control case (F) which are severely reduced in ACC-H (J). The callosal fibers rely on the midline glial structures to serve as guidance mechanisms. Image (G) shows normal vimentin positive indusium griseum glia (IGG) that guide the callosal axons of forceps minor. The horizontal IGGs are punctate in the ACTG1 variant (K). Callosal fibers cross the hemisphere by following tracts laid out by the glial wedge as seen in the control (H) which are absent in the ACTG1 variant (L). Scale bar in images (H,J,L) = 100 μm.
