FIGURE 5.

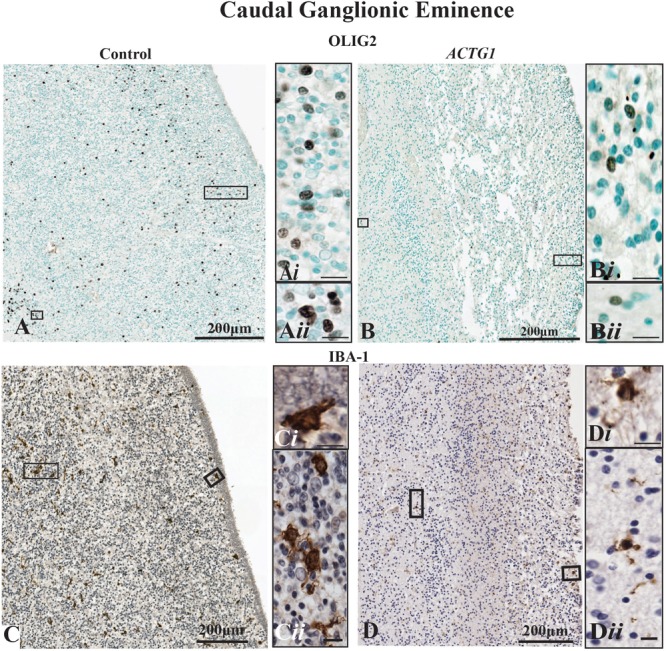
Oligodendroglia and microglia populations shown with markers for mouse anti-OLIG2 and rabbit anti-Iba-1. In the control case (image A) the OLIG2 positive cells are dispersed throughout the caudal ganglionic eminence (CGE), and the insets show densely OLIG2 positive nuclei (Ai,Aii) found throughout the CGE. Image (B) demonstrates that the OLIG2 positive nuclei in the CGE lack in the heterotopia and agenesis of the corpus callosum (ACC-H) case (insets Bi,Bii). The immunoreactivity of rabbit anti-Iba-1 shows ameboidal microglia (C) are seen in the beneath the ependymal cells (Ci) of the CGE and in regions adjacent to the white matter (Cii) of the control case. The ACTG1 variant (D) show Iba-1 immuno-stained microglia beneath the ependymal cells (Di), but in the CGE adjacent to the white matter the microglia in the ACTG1 variant are much smaller (Dii). Scale bar in inset images = 9 μm.
