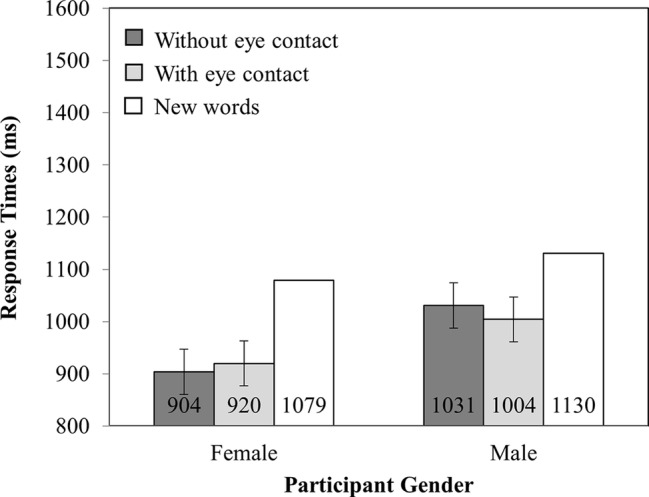
Figure 4.

RT as a function of Participant Gender (Female versus Male) and Investigator gaze (With eye contact versus Without eye contact). Note that new words have been plotted in this figure as a reference point, but were not included in the analysis. Error bars represent the 95% confidence interval as defined by Masson and Loftus (2003).
