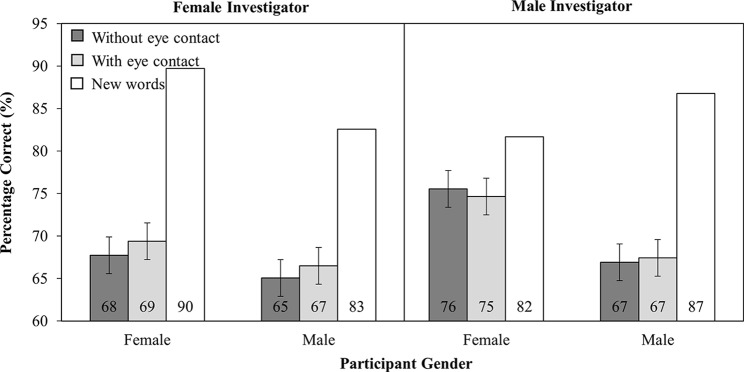
Figure 9.
Percentage correct as a function of Investigator Gender (Female versus Male), Participant Gender (Female versus Male), and Investigator gaze (With eye contact versus Without eye contact). Note that new words have been plotted in this figure as a reference point, but were not included in the analysis. Error bars represent the 95% confidence interval as defined by Masson and Loftus (2003).

