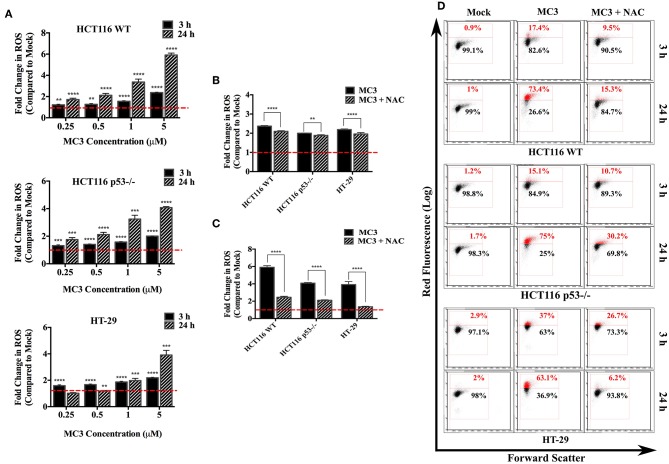
Figure 2.
Intracellular ROS levels are induced by MC3 in CRC cells. (A) CRC cell lines were treated with MC3 in a concentration-dependent manner as indicated, for either 3 or 24 h, thereafter ROS generation was analyzed by FACS using the dye, DHE. Data were normalized to the respective mock (0.1% DMF) treatment. Statistical comparison was made between each concentration and mock using two-tailed student's t-test. (B,C) The ROS scavenger, NAC significantly attenuates the induction in intracellular ROS levels with MC3 treatment (5 μM) in all three cell lines after 3 h (B) and 24 h (C) time points. Comparison of the fold difference in ROS production between NAC-treated and -untreated cells was performed using two-tailed student's t-test. (D) Representative density plots of one out of four biological replicates shown in (A–C). Error bars ± SD; n = 4. **, ***, and **** denote p-values ≤ 0.01, 0.001, and 0.0001, respectively.

