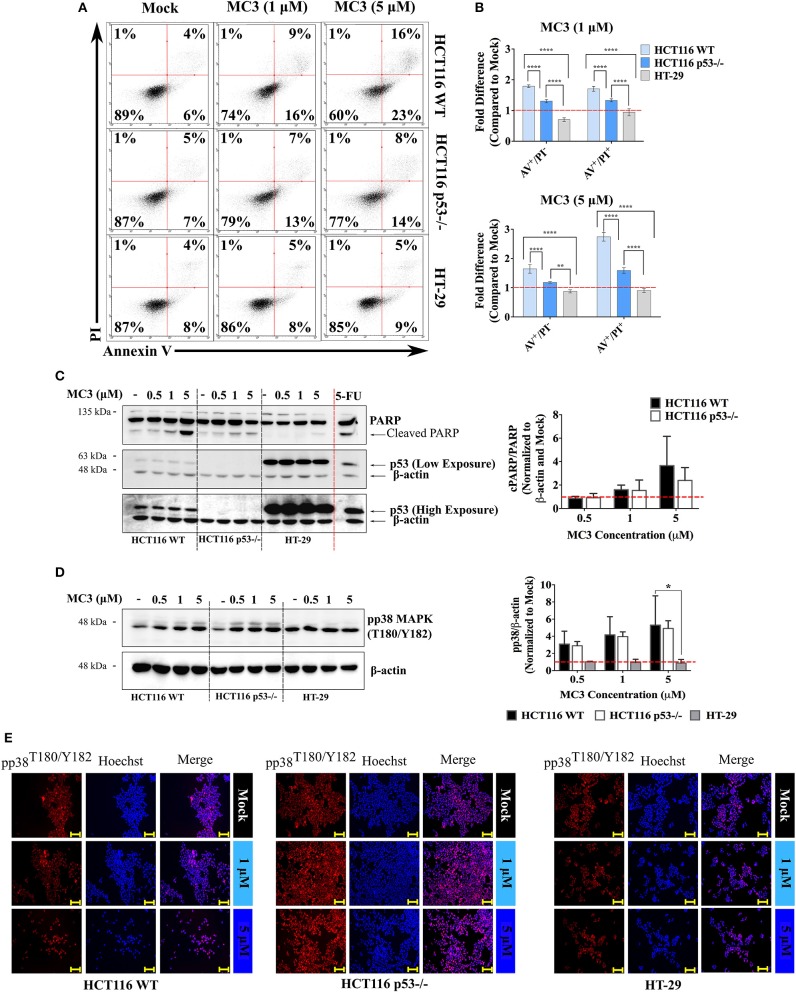
Figure 4.
MC3 differentially activates apoptotic markers across CRC cell lines. (A) Representative AV/PI graphs of CRC cells treated with 1 and 5 μM of MC3 for 24 h. Data show transition of HCT116 clones through the AV+/PI− and AV+/PI+ quadrants, an effect which is not detected in mutant p53-harboring HT-29 cells. (B) MC3 induces apoptotic/necrotic cell death in the isogenic HCT116 cell lines after 24 h at both tested concentrations (1 and 5 μM) as determined by annexin V/PI staining, however with a significantly higher efficacy in the presence of WT p53. Data represent mean ± SD from at least four biological replicates, one of which is depicted in (A). (C) and (D) Protein levels of cleaved PARP, a hall mark of apoptosis, as well as the pro-apoptotic signaling molecule, pp38 MAPK (T180/Y182) are induced by MC3 (24 h) in a concentration-dependent manner in HCT116 WT and p53−/−, but not in HT-29 cells. β-actin served as the loading control. HCT116 WT cells were treated with a concentration of 100 μM of 5-FU for 24 h as a positive control for PARP cleavage. Bar graphs show densitometric analyses of cPARP/PARP and pp38 MAPK (T180/Y182) bands normalized to their respective loading controls and mock treatments. Error bars are the SEM of two independent experiments, one immunoblot of which is presented. Multiple comparisons were performed using two-way ANOVA test and a post-hoc Tukey test. *, **, and **** denote p-values ≤ 0.05, 0.01, and 0.0001, respectively. (E) Consistent with immunoblotting, MC3 induces pp38 MAPK (T180/Y182) nuclear accumulation in WT and p53-deficient HCT116 cells, but not in HT-29. Cells were treated with various concentrations of MC3 as indicated for 24 h, after which immunocytochemistry was employed using specific antibodies. Hoechst dye was used to visualize nuclei. Scale bar: 200 μm. Vehicle (0.1% DMF)-treated cells served as mock.

