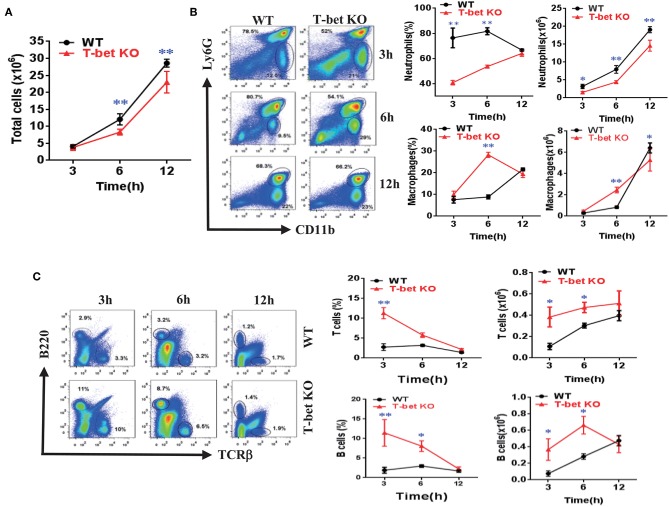
Figure 4.
Weakened inflammatory cell infiltration of MSU-induced peritonitis in T-bet KO mice. (A) 3 mg/0.5 mL MSU suspension was injected into the peritoneal cavity, and the lavage fluid was harvested at different time points. Total cell number (A) was counted by a hematocytometer. (B) neutrophils and macrophages were analyzed by flow cytometry. Macrophages were represented by CD11b+, while neutrophils represented by Ly6G+. (C) T cells and B cells were analyzed by flow cytometry. T cells were represented by TCRβ+, and B cells by B220+. Results are representative of 3 independent experiments. n = 3–5 for each group and unpaired t-test was used for each group at indicated time points. *P < 0.05, **P < 0.01. KO, knockout; MSU, monosodium urate; WT, wild type.

