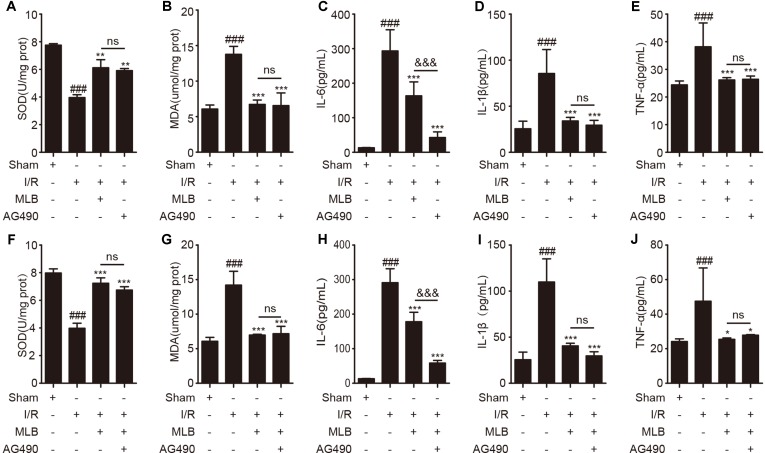
Figure 6.
AG490 or MLB+AG490 pretreatment affected oxidative stress in liver and inhibited inflammatory factors’ expression. (A, B) The expression of SOD and MDA in liver tissue of sham, I/R, MLB, and AG490 groups. (C–E) Serum IL-6, IL-1β, and TNF-α were detected by ELISA in sham, I/R, MLB, and AG490 groups. (F–G) The expression of SOD and MDA in liver tissue of sham, I/R, MLB, and MLB+AG490 groups. (H–J) Serum IL-6, IL-1β, and TNF-α were detected by ELISA in sham, I/R, MLB, and MLB+AG490 groups. The data are expressed as mean ± SD; n = 5 for each group; ns: no statistical significance; ###P < 0.001 versus sham group; *P < 0.05, **P < 0.01, and ***P < 0.001 versus I/R group; &&&P < 0.001 versus MLB group.

