
Figure 1.
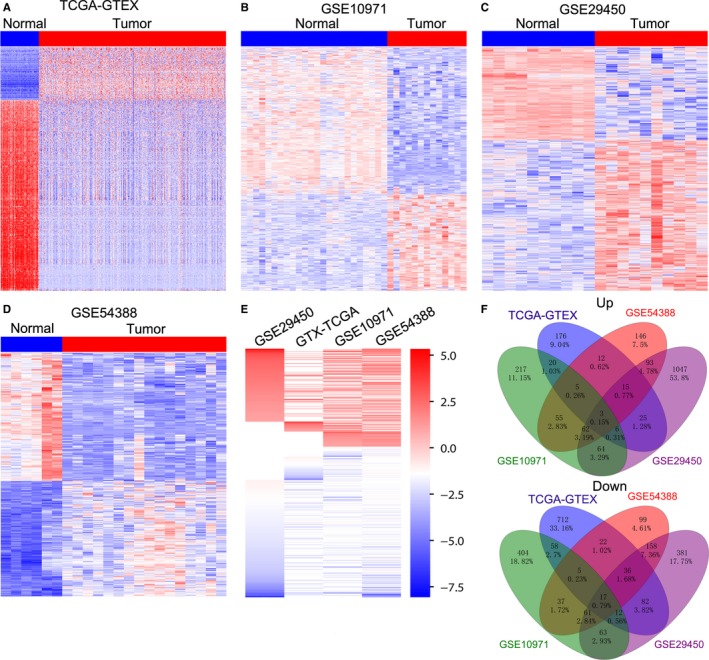
Differential profiling analyses of lncRNAs expression in ovarian cancer tissues and normal tissues. A, A heatmap was drawn to show the altered lncRNAs expression in ovarian cancer specimen from TCGA compared with normal samples from the GTEx. B‐D, Heatmaps were drawn to show the dysregulated lncRNAs in ovarian cancer specimen compared with normal tissues in the GSE10971, GSE29450, GSE54388 datasets. E, A heatmap was drawn to show the up‐regulated or down‐regulated lncRNAs (consistently in at least two datasets, fold change) in TCGA/GTEx, GSE10971, GSE29450, and GSE54388 datasets. F, Venn diagram of altered up‐regulated or down‐regulated lncRNAs in TCGA/GTEx, GSE10971, GSE29450, and GSE54388 datasets