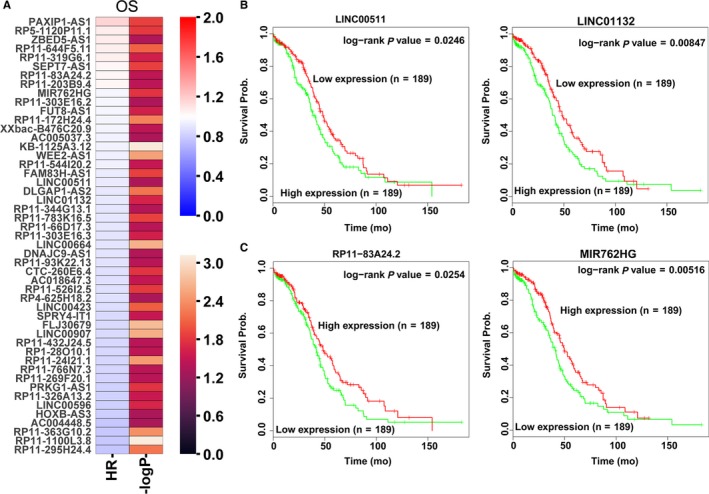
Figure 3.

Ovarian cancer patients’ overall survival related lncRNAs analyses. A, A heatmap was drawn to show the overall survival associated lncRNAs Hazard ratio value and ‐log P value in ovarian cancer using the TCGA clinical data. B, The Kaplan‐Meier curve for ovarian cancer patients overall survival in high‐ or low‐ LINC00511 and LINC01132 groups using the TCGA clinical data was conducted with two‐sided log‐rank test. C, The Kaplan‐Meier curve for ovarian cancer patients overall survival in high‐ or low‐ RP11‐83A24.2 and MIR762HG groups using the TCGA clinical data was conducted with two‐sided log‐rank test
