
Figure 3.
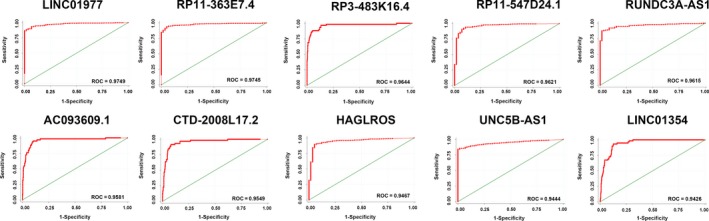
Receiver operating characteristic (ROC) curves of the top 10 long noncoding RNAs (lncRNAs) in papillary thyroid carcinoma (PTC) sorted by area under the ROC curve (AUC). Note: Red represents the sensitivity curve, and green indicates the identification line. The X axis shows the false positive rate, presented as “1‐Specificity”. The Y axis indicates the true positive rate, shown as “Sensitivity”. These curves were provided by STATA 12.0