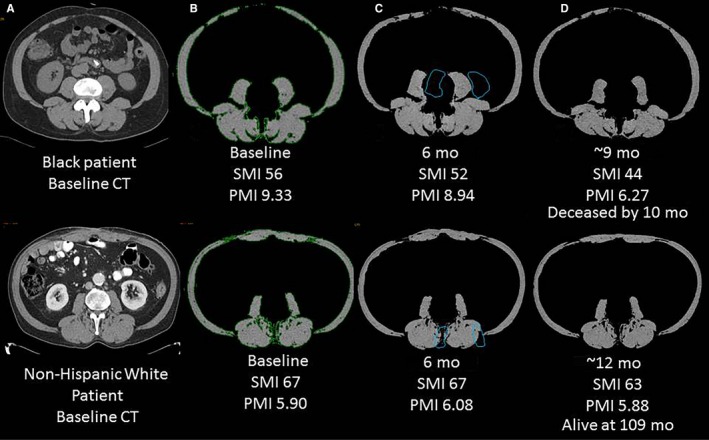
Figure 3.

Axial CT images for a Black (top panel) and NHW PC patient (bottom panel). A, Baseline/preoperative image at the inferior endplate of L3 vertebral body. B, Axial image after skeletal muscle is segmented (in green) and non‐muscular structures are excluded using a HU threshold of −29‐+150. C and D, six and 12 mo postoperative follow‐up CT exams showed downward trends in SMI and PMI, especially for the Black patient. Psoas muscle area is outlined in blue on images. Skeletal muscle and psoas muscle areas were calculated on each exam and indexed for patient's height. Note: The NHW patient has higher baseline SMI but lower PMI than the Black patient which can be explained by the relative smaller size of psoas muscles with respect to other skeletal muscles. CT, computed tomography; HU, hounsfield unit; NHW, Non‐Hispanic White; PC, pancreatic cancer; PMI, psoas muscle index; SMI, skeletal muscle index
