
Figure 1.
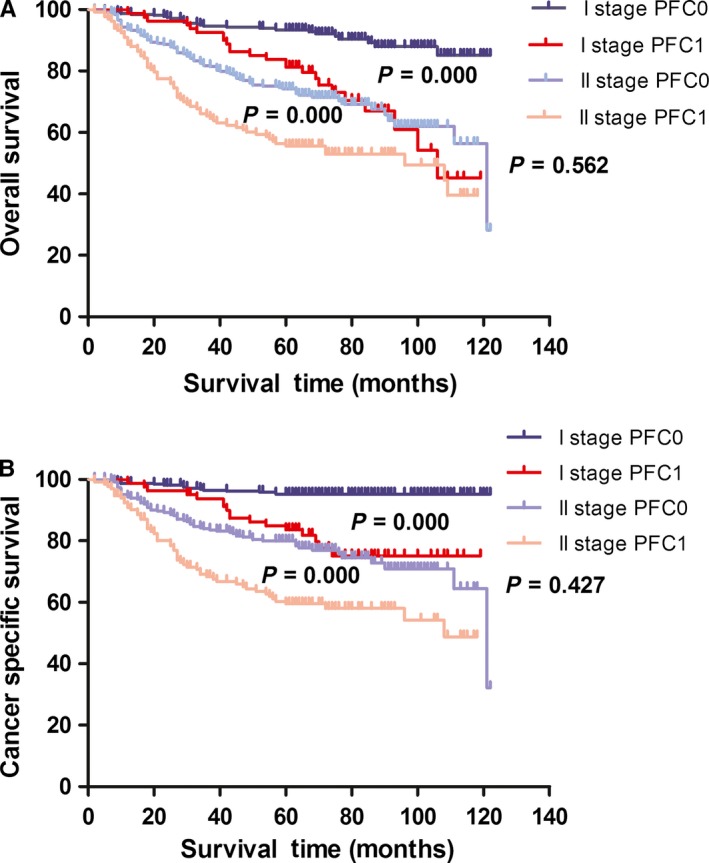
Kaplan‐Meier curves for OS and CSS according to PFC level in GC patients with TNM stage I and II. Patients with TNM stage I‐PFC1 and TNM stage II‐PFC0 had a similar OS (A: P = 0.562) and CSS (B: P = 0.427). OS, overall survival; CSS, cancer‐specific survival; PFC0, plasma fibrinogen concentration <4 g/L; PFC1, plasma fibrinogen concentration ≧4 g/L