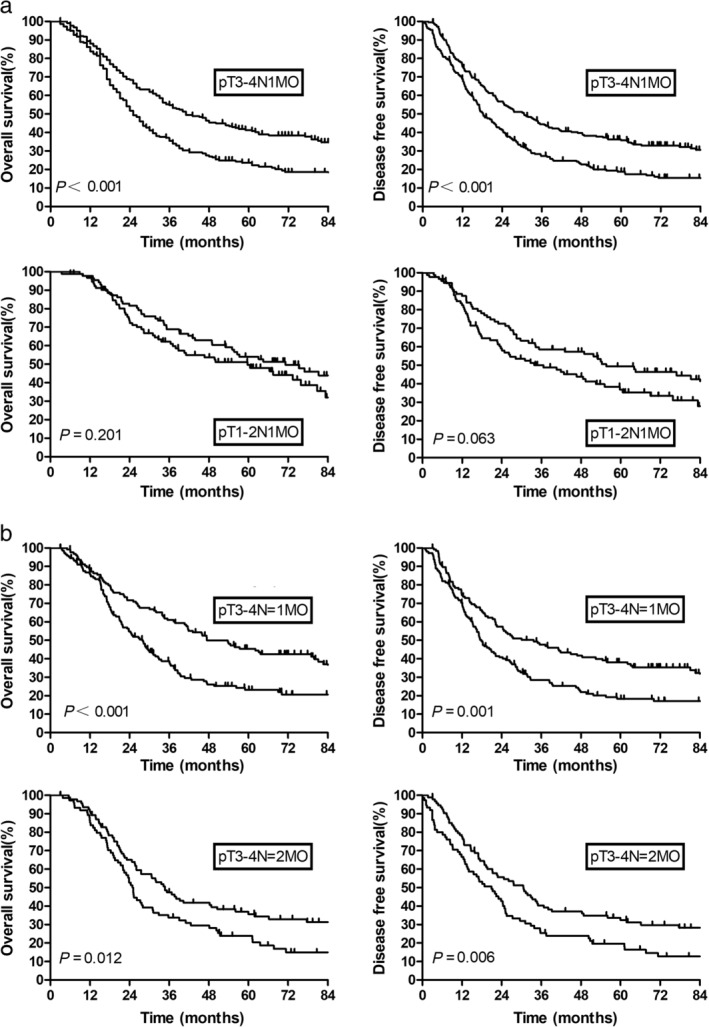
Figure 3.

(a) Overall survival and disease‐free survival by pathological stage; (b) Overall survival and disease‐free survival for pT3–4N1M0 subgroup. ( ) PORT, and (
 ) Surgery alone.

(a) Overall survival and disease‐free survival by pathological stage; (b) Overall survival and disease‐free survival for pT3–4N1M0 subgroup. ( ) PORT, and (
 ) Surgery alone.