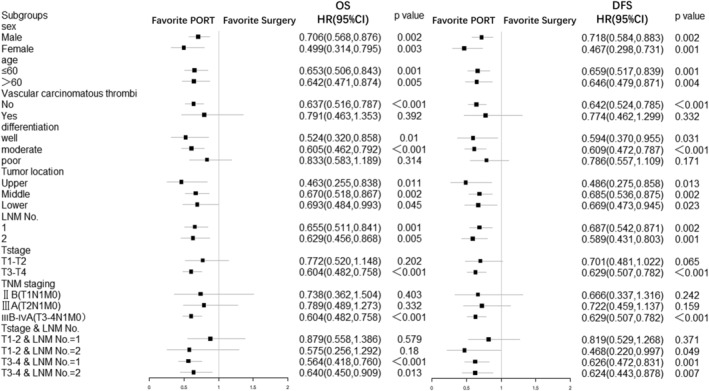
Figure 4.

Hazard ratios for death and recurrence, according to subgroup characteristics. This forest plot shows univariate hazard ratios for death and recurrence and 95% confidence intervals for 622 patients with esophageal cancer, according to baseline characteristics. CI, Confidence interval; DFS, disease‐free survival; HR, hazard ratio; LNM, lymph node metastasis; OS, overall survival; PORT, postoperative radiotherapy.
