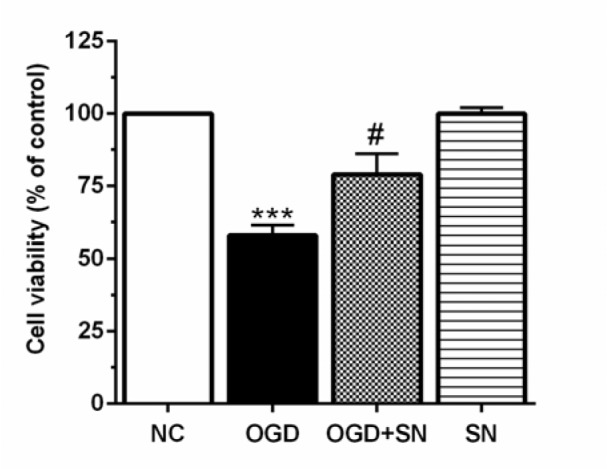
Figure 5. SN increased cell viability in PC12 cells-exposed to 4 h OGD. Data are presented as the percentage of control (OGD 0, normoxic normoglycemic) (n=3): ***p<0.001 vs. NC; #p<0.05 vs. OGD [NC: normal control; OGD: oxygen and glucose deprivation (4 h); OGD-SN: oxygen and glucose deprivation (4 h) co-treated with SN (100 µm); SN: sodium nitrite (100 µm) treated].

