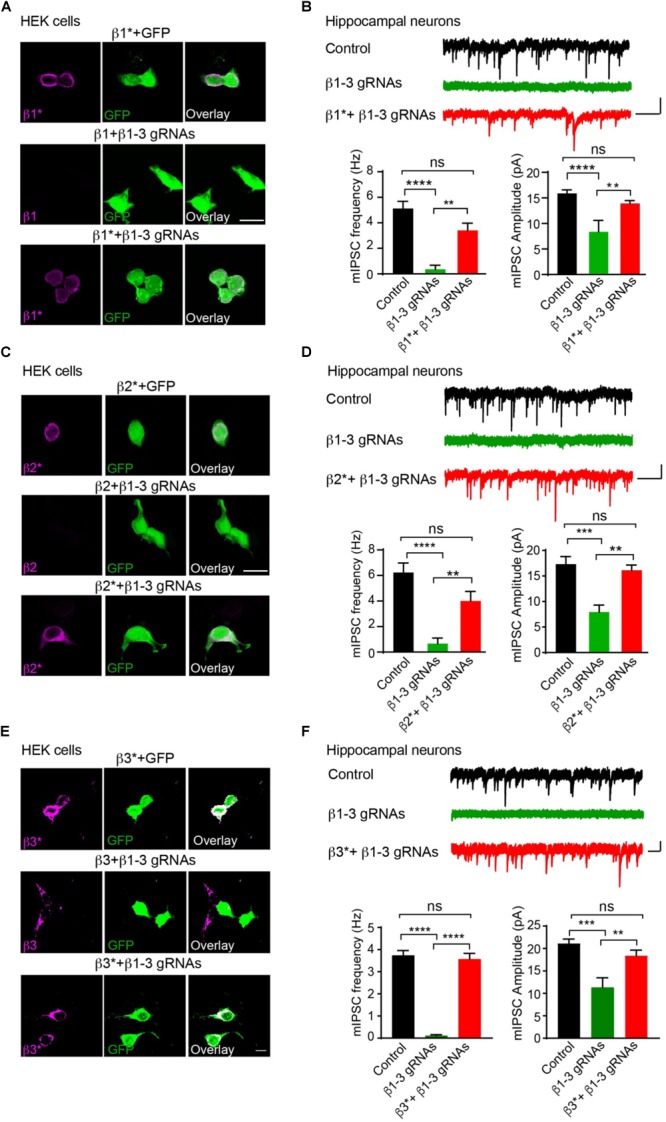
FIGURE 2.

Rescue of GABAergic transmission in neurons expressing β1-3 gRNAs by gRNA resistant β1∗, β2∗, or β3∗. (A) Representative images showed that β1-3 gRNA failed to reduce the expression of the gRNA resistant β1 (β1∗) in HEK293T cells. Scale bar, 5 μm. (B) mIPSC recording showed that β1∗ largely rescued the loss of GABAergic transmission in neurons expressing β1-3 gRNAs (n = 18, 8, and 15 for control, β1-3 gRNAs, β1∗ + β1-3 gRNAs, respectively; N = 3; One-way ANOVA followed by the Bonferroni test, ∗∗p < 0.01, ∗∗∗∗p < 0.0001). Scale bar, 500 ms, 20 pA. (C) Representative images showed that β1-3 gRNA failed to reduce the expression of the gRNA resistant β2 (β2∗) in HEK293T cells. Scale bar, 5 μm. (D) mIPSC recording showed that β2∗ largely rescued the loss of GABAergic transmission in neurons expressing β1-3 gRNAs [n = 23, 8, and 12 for control, β1-3 gRNAs, β2∗ + β1-3 gRNAs, respectively; N = 3; One-way ANOVA followed by the Bonferroni test, ∗∗p < 0.01, ∗∗∗∗p < 0.0001 (for frequency), ∗∗∗p < 0.001 (for amplitude)]. Scale bar, 500 ms, 20 pA. (E) Representative images showed that β1-3 gRNA failed to reduce the expression of the gRNA resistant β3 (β3∗) in HEK293T cells. Scale bar, 5 μm. (F) mIPSC recording showed that β3∗ rescued the loss of GABAergic transmission in neurons expressing β1-3 gRNAs (n = 12, 12, and 12 for control, β1-3 gRNAs, β3∗ + β1-3 gRNAs, respectively; N = 3; One-way ANOVA followed by the Bonferroni test, ∗∗p < 0.01, ∗∗∗p < 0.001, ∗∗∗∗p < 0.0001). Scale bar, 500 ms, 20 pA. n represents the number of cells analyzed and N represents the number of independent experiments.
