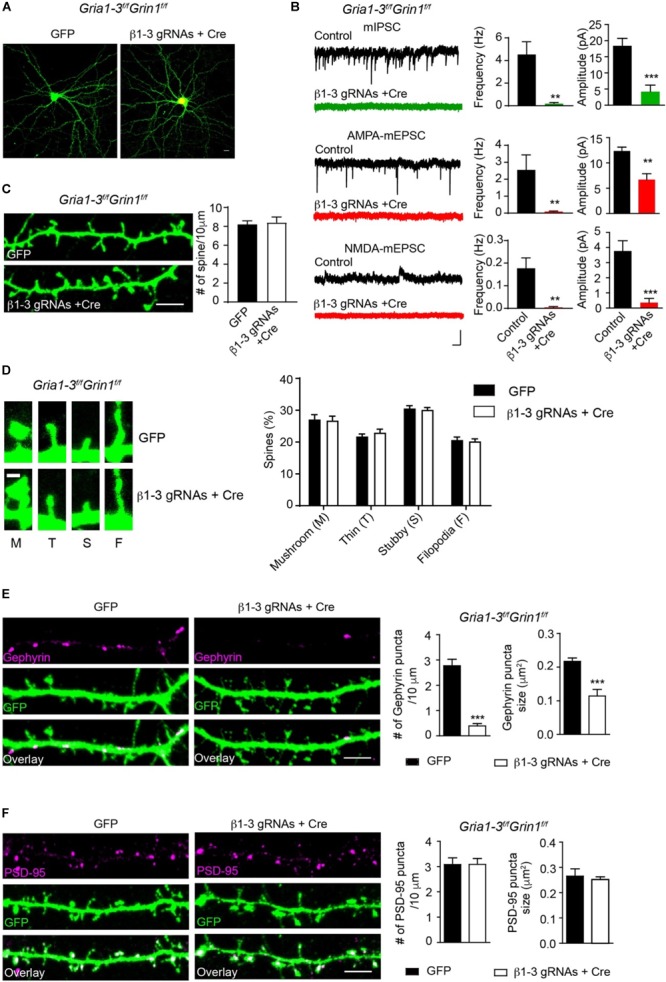
FIGURE 5.

Genetic deletion of GABAARs, AMPARs, and NMDARs impaired inhibitory, but not excitatory synapses. (A) Representative images showed neurons cultured from GRIA1-3fl/flGRIN1fl/fl mice expressing empty gRNA vector (GFP, left) or expressing both Cre-mCherry/ β1-3 gRNAs(right). Scale bar, 10 μm. (B) Representative traces and bar graph showed the loss of GABAAR mIPSC, AMPAR-, or NMDAR- mediated mEPSCs in Cre/GFP-positive neurons (mIPSC: control, n = 7; Cre + β1-3 gRNAs, n = 7; frequency: ∗∗p < 0.01; amplitude: ∗∗∗p < 0.001; AMPA mEPSC: control, n = 9; Cre + β1-3 gRNAs, n = 10; frequency: ∗∗p < 0.01; amplitude: ∗∗p < 0.01; NMDA mEPSC: control, n = 7; Cre + β1-3 gRNAs, n = 7; frequency: ∗∗p < 0.01; amplitude: ∗∗∗p < 0.001; t-test; N = 2). Scale bar, 500 ms, 20 pA. (C) Spine density in GRIA1-3fl/flGRIN1fl/fl hippocampal neurons expressing either GFP or β1-3 gRNAs plus Cre-mCherry (GFP, n = 20; β1-3 gRNAs + Cre, n = 20; p > 0.05, t-test; N = 3). GFP was immunolabeled with anti-GFP antibodies to boost the fluorescence (green). Scale bar, 5 μm. (D) Normal spine types in GRIA1-3fl/flGRIN1fl/fl hippocampal neurons expressing β1-3 gRNAs and Cre (GFP, n = 25; β1-3 gRNAs + Cre, n = 26; p > 0.05, t-test; N = 3). GFP was immunolabeled with anti-GFP antibodies to boost the fluorescence (green). Scale bar 1 μm. (E) Single-cell genetic deletion of GABAARs, AMPARs, and NMDARs dramatically reduced the gephyrin puncta for about 90% (GFP, n = 28; β1-3 gRNAs + Cre, n = 24; ∗∗∗p < 0.0001 for puncta density; ∗∗∗p < 0.0001 for puncta size, t-test; N = 3). GFP was immunolabeled with anti-GFP antibodies to boost the fluorescence (green). Scale bar, 5 μm. (F) Single-cell genetic deletion of GABAARs, AMPARs, and NMDARs did not change the PSD-95 puncta (GFP, n = 22; β1-3 gRNAs + Cre, n = 31; p > 0.05 for both comparisons, t-test; N = 3). GFP was immunolabeled with anti-GFP antibodies to boost the fluorescence (green). Scale bar, 5 μm. n represents the number of cells analyzed and N represents the number of independent experiments.
