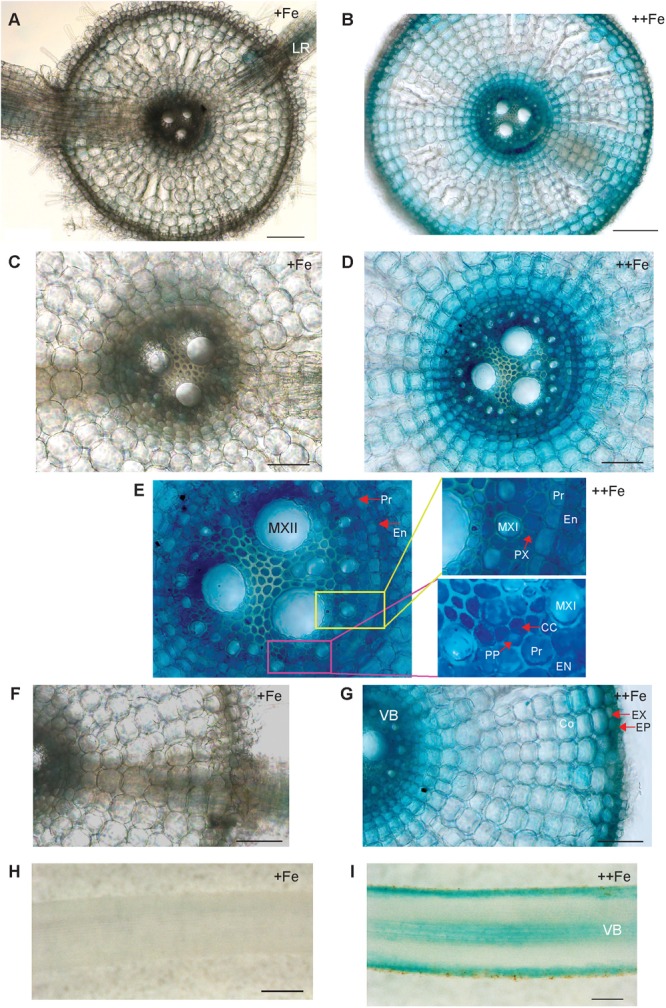
FIGURE 1.

Cellular localization of OsNAS3 promoter-GUS expression in roots. (A) Transverse section of control root. (B) Transverse section of Fe-excess root. (C,D) Enlarged views of vascular tissues shown in (A,B), respectively. (E) An enlarged view of xylem and phloem shown in (D). (F,G) Enlarged views of outer root layers shown in (A,B), respectively. (H) Longitudinal section of control root. (I) Longitudinal section of Fe-excess root. LR, lateral root; MXI, metaxylem I; MXII, metaxylem II; PP, protophloem; CC, companion cells; EN, endodermis; Pr, pericycle; PX, protoxylem; EX, exodermis; EP, epidermis; Co, cortex; VB, vascular bundle. Scale bars: 20 μm for (A–D,F,G); 100 μm for (H,I).
