
FIGURE 4.
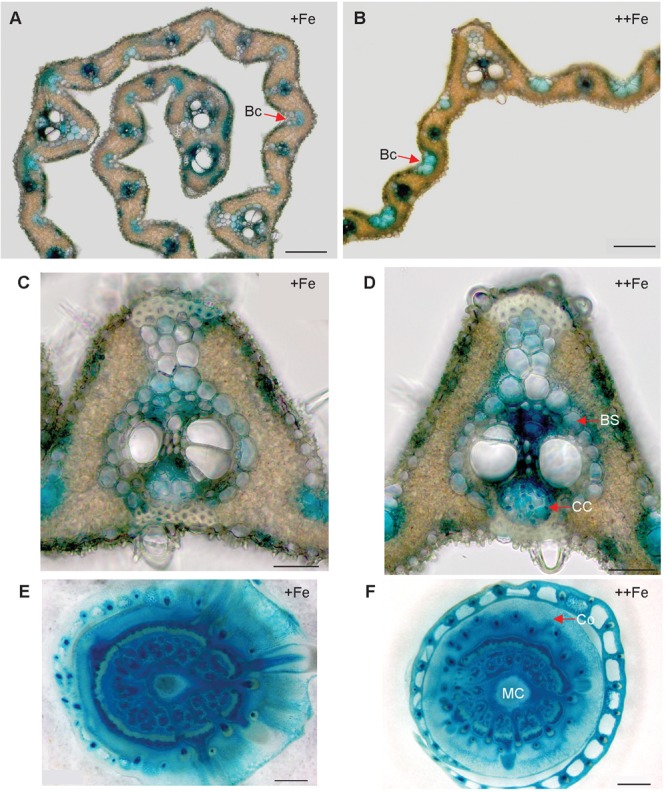
Cellular localization of OsNAS3 promoter-GUS expression in the newest leaves and DCs. (A) Transverse sections of the control newest leaf. (B) Fe-excess newest leaf. (C,D) Enlarged views of (A,B), respectively. (E) Control DC. (F) Fe-excess DC. Bc, bulliform cells; BS, bundle sheath cells; CC, companion cells; Co, cortex; MC, medullary cavity. Scale bars: 20 μm for (A–D); 500 μm for (E,F).