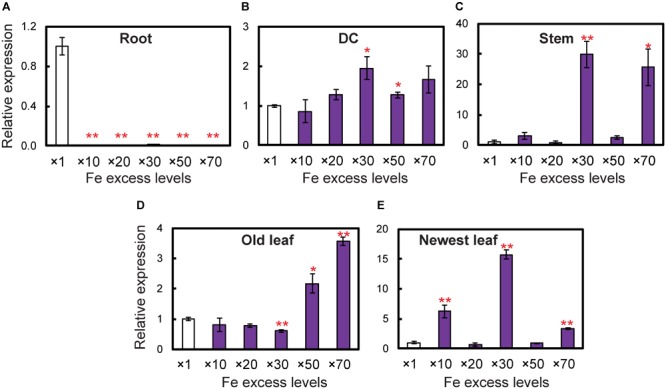
FIGURE 5.

Expression levels of the OsDMAS1 gene in rice tissues under control and various Fe excess conditions. (A) Roots. (B) DCs. (C) Stems. (D) Old leaves. (E) Newest leaves. DC, discrimination center. This figure shows confirmation of the microarray results listed in Table 1 of Aung et al. (2018) from qPCR analyses. Error bars represent ± 1 standard error (SE) of the technical variation, n = 3. Data were normalized to the observed expression levels of alpha-tubulin and presented as relative gene expression in each tissue (×1 Fe = 1). Asterisks above the bars indicate significant differences (∗P < 0.05; ∗∗P < 0.01) compared to the control (×1 Fe).
