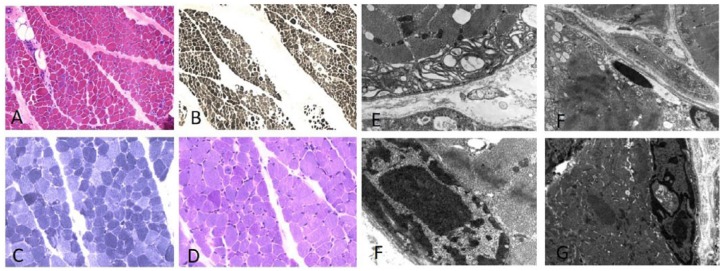
Figure 2.
Muscle biopsy of patient 2 shows diffuse fibre atrophy and some central nuclei with haematoxylin–eosin stain (A). Acid ATPase (pH 4) shows 92% type 1 fibre predominance (B). Nicotinamide adenine dinucleotide tetrazolium reductase (NADH-TR) showed abnormal nuclei and mitochondrial accumulation (C), periodic acid–Schiff (PAS) stain shows deposit of glycogen localized in some fibres (D). Ultrastructural analysis shows atrophic fibres with myelinoid body in subsarcolemmal position (E), cytoplasmatic body with mitochondrial alterations and vacuoles in nuclei (F). Abnormal dense nuclei with central vacuoles can be seen in (F, G).

