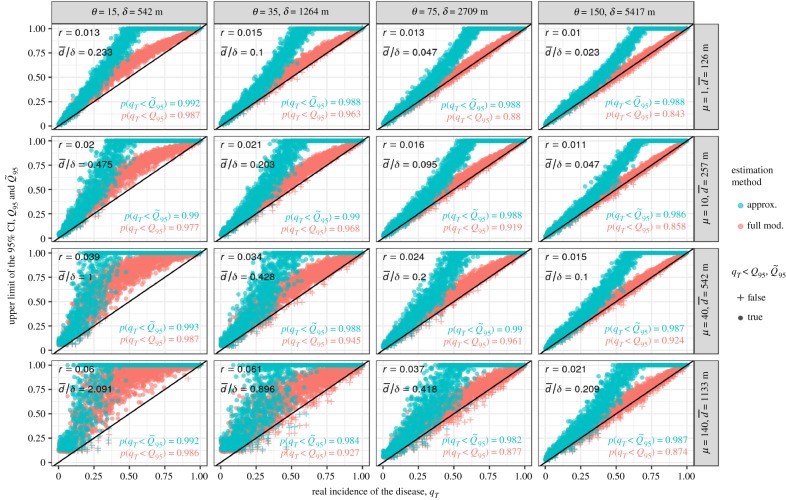
Figure 3.
Estimation of Q95 and from sampling series realized on spatially explicit epidemics, i.e. simulated with the dispersal kernel (equation (2.14)). These estimations are made for varying dispersal ranges θ and host aggregations μ, while maintaining constant values of the non-spatial parameters (N = 100, Δ = 30, σ = 30, K = 5, as well as β = 75 and b = 0.45 for the remaining kernel parameters). For better understanding, θ and μ are shown with their distance translation in metres, δ and . The identified logistic growth rate r is given for each experiment. The resulting distributions of Q95 and are qualitatively similar for other realistic values of the fixed parameters. (Online version in colour.)

