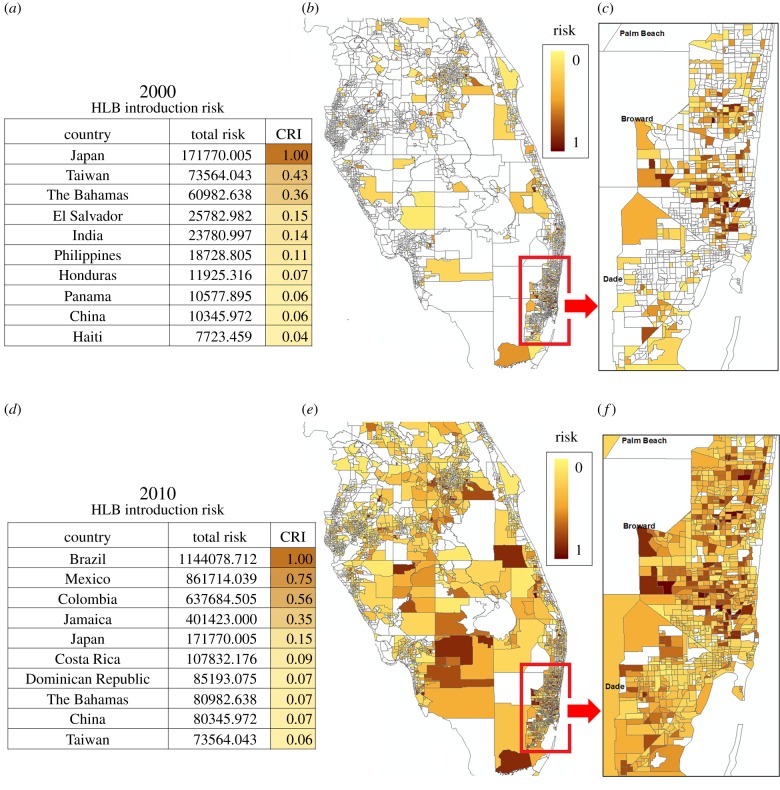
Figure 2.
Census-travel model introduction risk for citrus HLB in Central and South Florida citrus-producing regions, comparing retrospective and recent risk estimates (note that HLB spread within/between USA is not explicitly considered). (a,d) Source CRIs for the top 10 countries of highest risk contribution in 2000 and 2010, respectively. Note, over time, Brazil emerged as the largest contributor of HLB risk of introduction for Florida. (b,e) Introduction risk estimates by census tract for 2000 and 2010. (c,f) Higher resolution metropolitan Miami demonstrating the shift in risk distribution for introduction points.

