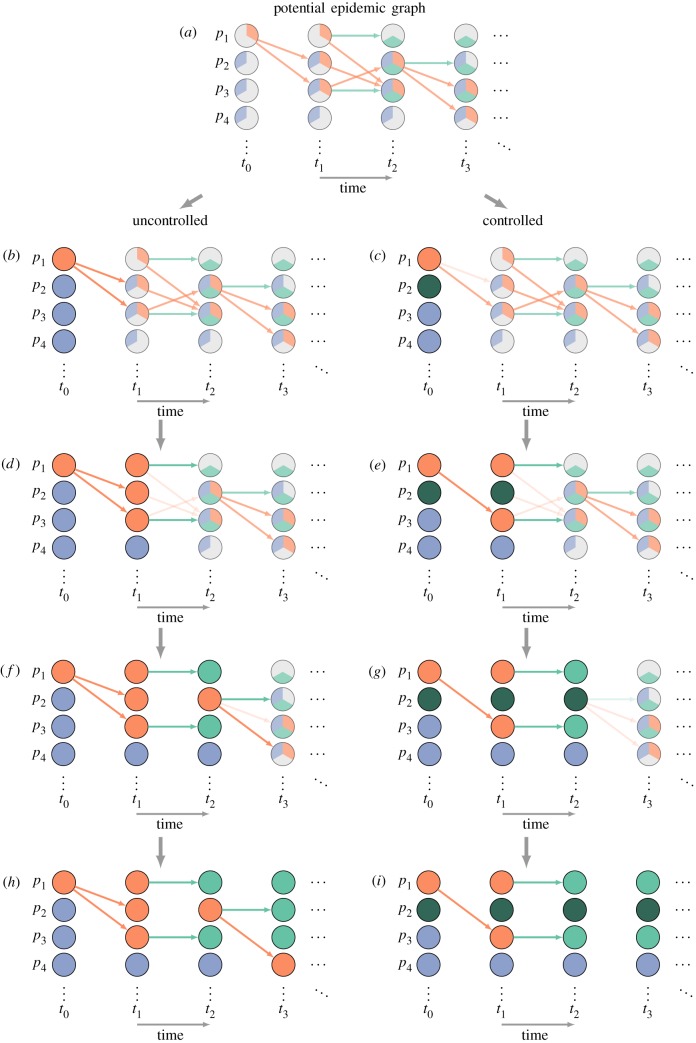
Figure 3.
‘Single-world’ simulation process (continued). In order to measure the impact of the intervention on the epidemic, we use the PEG (figure 2) to construct two epidemics: one uncontrolled (left), one with intervention (right). We start by setting the actual state (denoted by colouring the whole circle) of each individual at time t0 to their initial condition, and then changing their state according to the intervention, in this case setting p2 as vaccinated (dark green). We then prune events between t0 and t1: removing inconsistent events and allowing the intervention to stochastically remove events (b,c). We then use those events to determine the actual state of each individual at t1, allow the intervention to alter that state, then prune inconsistent events again (d,e). We repeat the process for times t2 (f,g), t3 (h,i) and so on. This final graph can be used to extract our outcome of interest. Any graphs made from the same PEG represent the results of different interventions in a ‘single world’.

