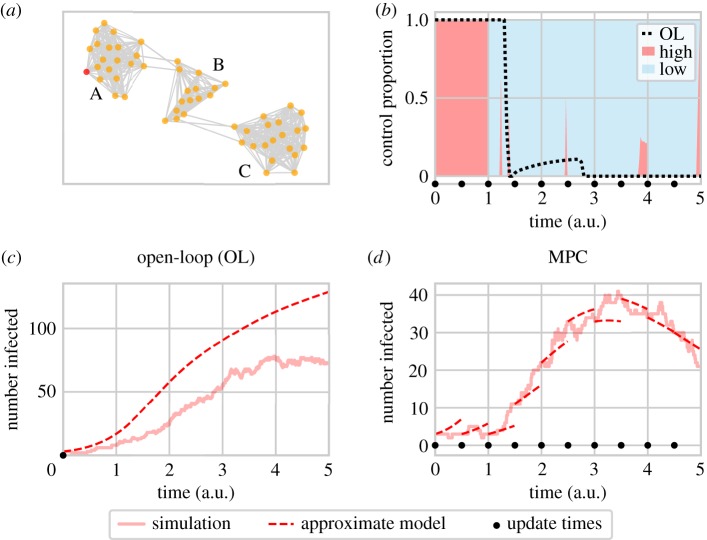
Figure 2.
(a) The network used for the illustrative simulation model, including region labels. The epidemic is seeded in the red node in region A, and can spread between connected nodes (grey lines). In (b), the control allocation is shown for a single space-based MPC run, with the corresponding open-loop allocation indicated by the black dotted line. (c) The total number of infected individuals under a single run of space-based open-loop control. Control is based on the prediction of the approximate model starting from the initial conditions. (d) The number of infected individuals in the simulation and space-based approximate model corresponding to the MPC control carried out in (b). Here the prediction is reset to match the simulation at every update step (0.5 time units) and the control is re-optimized. By repeatedly correcting for differences between short-term model predictions and realized numbers of infected individuals—rather than relying on a potentially increasingly inaccurate prediction made at the initial time—MPC gives better predictions of the simulation state as well as improved control when compared with open-loop (note different y-axis scales). a.u., arbitrary units.

