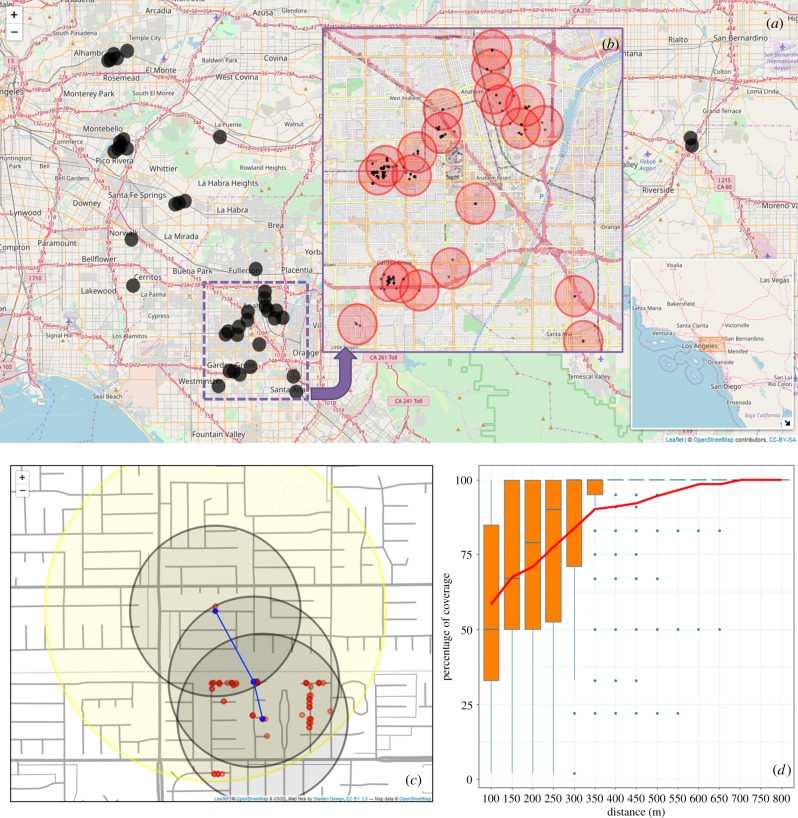
Figure 2.
(a) Spatio-temporal cluster analysis identified 41 HLB clusters in southern California when using an 800 m delimitation distance. (b) High-resolution inset image of HLB clusters in Orange County. (c) Reconstructed timeline of HLB-positive tree detections in one infection cluster in Anaheim, CA. The large, yellow circle identifies the original 800 m delimitation survey; the smaller, black circles demonstrate a 400 m delimitation survey, starting with the initial find and iteratively capturing all confirmed CLas+ trees. (d) Summary results for data resampling simulation experiments showing the cumulative percentage of detections achieved by delimitation surveys of different radii using all known detection data from California from the period 2012 to December 2017. The simulations indicate that greater than 90% of all known positive trees would have been detected by delimitation surveys of 400 m radius; the eradication programme operated with a radius of 800 m during this period. (Online version in colour.)

