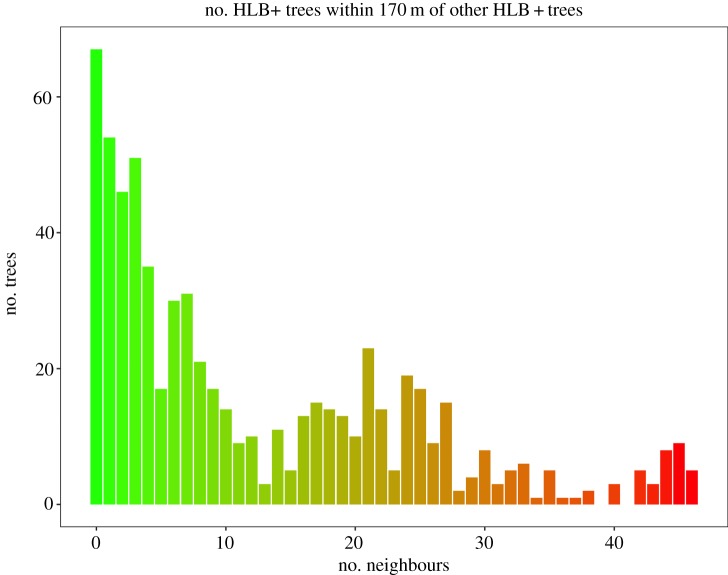
Figure 4.
The distribution of density of infected citrus trees within 170 m of newly detected, infected trees. Note that many newly detected trees have no, or few, other infected trees within 170 m at the time of detection, but several have in the order of 20–30 infected close neighbours, and there is a set of trees that have 40 or more infected neighbours. (Online version in colour.)

