
Figure 6.
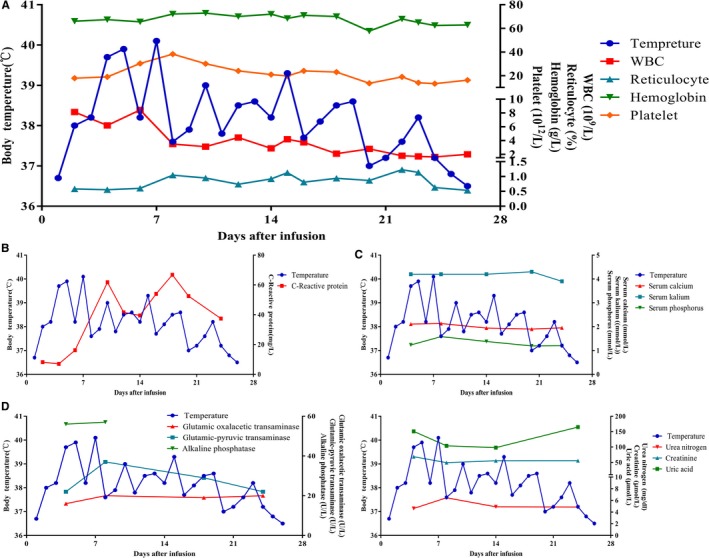
The dynamic variation of body temperature and blood cell count (A), C‐reaction protein (B), serum electrolyte (C), serum hepatorenal function (D&E) during and after the CART‐19 cell infusion
Official websites use .gov
A
.gov website belongs to an official
government organization in the United States.
Secure .gov websites use HTTPS
A lock (
) or https:// means you've safely
connected to the .gov website. Share sensitive
information only on official, secure websites.
The dynamic variation of body temperature and blood cell count (A), C‐reaction protein (B), serum electrolyte (C), serum hepatorenal function (D&E) during and after the CART‐19 cell infusion