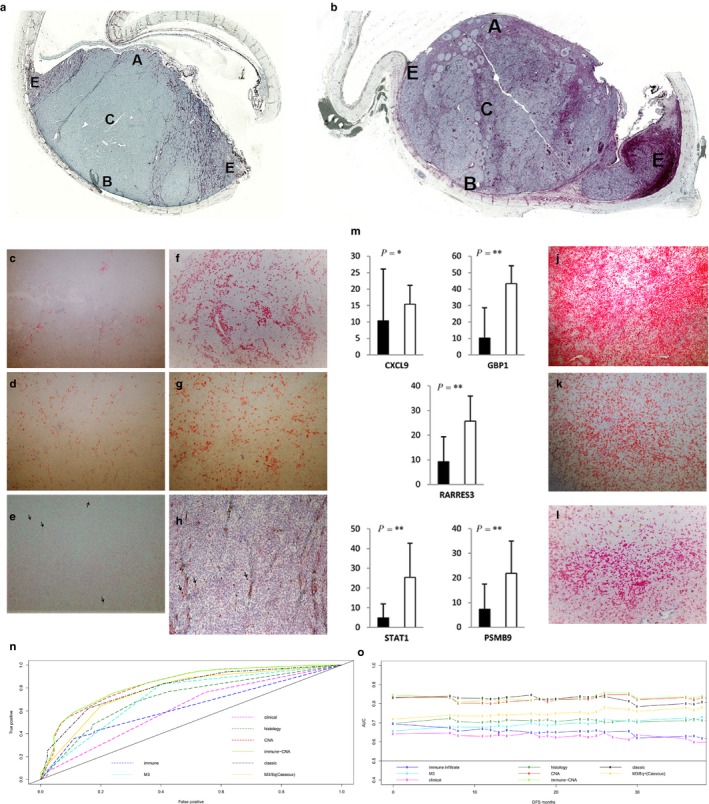
Figure 3.

Immune signature defined by immunohistochemistry and ROC curves. a‐l: Intra‐tumoral distribution of immune cells in immune infiltrate‐low (a) and immune infiltrate‐high (b) uveal melanomas: edges (E), base (B), center (C) and apex (A). HLA‐DRA+ (c,f,j) and CD163+ (d,g,k) macrophages and CD3+T‐lymphocytes (e,h, black arrows & l) in immune infiltrate‐low and high uveal melanomas (Original magnification: 50X and 100X). (m) Expression of significant “immune” genes in immune infiltrate‐high (n = 5, □) and immune infiltrate‐low (n = 16, ■) uveal melanomas (P‐value: *≤0.05, **<0.01). (n‐o) Time‐dependent ROC curves (n) and AUC plots (o) up to 36 months for DFS for Cox univariate and multivariate models
