
Figure 4.
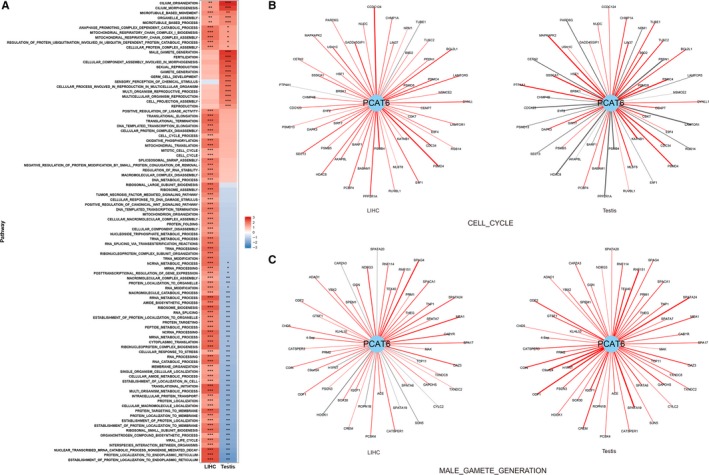
Coexpression analysis and gene set enrichment analysis (GSEA) of PCAT6. (A) Heatmap of normalized enrichment score (NES) derived from GSEA of PCAT6 in 371 LIHC samples and 259 testis samples. ***P < 1.60 × 10⁻⁵; **P < 0.01; *P < 0.05. (B) The coexpression pattern of PCAT6 and genes in the cell cycle pathway in LIHC and testis samples, respectively. The lead 50 coexpressed genes in LIHC samples are presented. Red line denotes positive correlation and gray line denotes negative correlation. The width of the line denotes the absolute value of the correlation coefficient. (C) The coexpression patterns of PCAT6 and genes in the male gamete generation pathway in LIHC and testis samples, respectively. The lead 50 coexpressed genes in testis samples are presented. Red line denotes positive correlation and gray line denotes negative correlation. The width of the line denotes the absolute value of the correlation coefficient