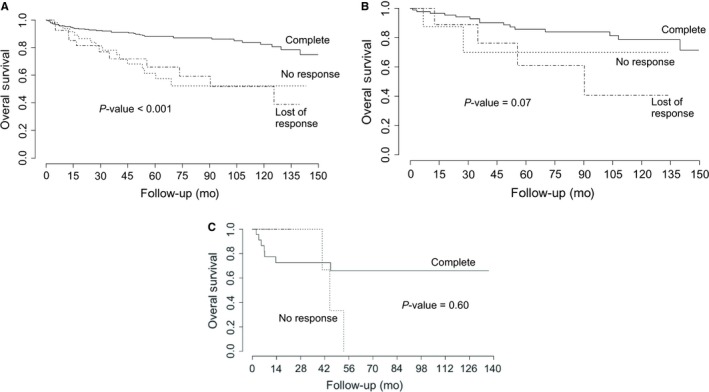
Figure 4.

Overall survival of patients with chronic myeloid leukemia in A, the chronic phase; B, the blastic phase; and C, the accelerated phase treated at the National Cancer Institute – Mexico, 2000‐2016, according to hematologic response. P‐values were obtained using the log‐rank test
